OPEN-SOURCE SCRIPT
The RSP/VOO indicator
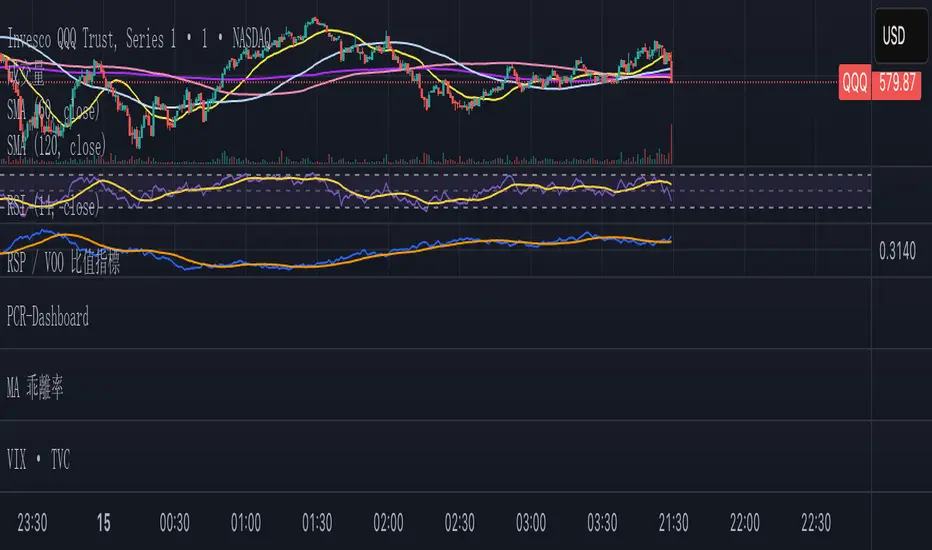
The RSP/VOO indicator refers to the ratio between the performance of two exchange-traded funds (ETFs): RSP (Invesco S&P 500 Equal Weight ETF) and VOO (Vanguard S&P 500 ETF). RSP tracks an equal-weighted version of the S&P 500 index, meaning each of the 500 stocks in the index is given the same weight regardless of company size. In contrast, VOO is a market-cap-weighted ETF, where larger companies (like Apple or Microsoft) have a greater influence on the fund's performance based on their market capitalization.
This ratio (RSP divided by VOO) is often used as a market breadth indicator in finance. When the RSP/VOO ratio rises, it suggests that smaller or mid-sized stocks in the S&P 500 are outperforming the largest ones, indicating broader market participation and potentially healthier overall market conditions. Conversely, when the ratio falls, it implies that a few mega-cap stocks are driving the market's gains, which can signal increased concentration risk or a narrower rally. For example, RSP provides more diversified exposure by reducing concentration in large-cap stocks, while VOO reflects the dominance of top-weighted holdings. Investors might monitor this ratio to gauge market sentiment, with RSP historically showing higher expense ratios (around 0.20%) compared to VOO's lower fees (about 0.03%), but offering potentially better risk-adjusted returns in certain environments.1.6秒
This ratio (RSP divided by VOO) is often used as a market breadth indicator in finance. When the RSP/VOO ratio rises, it suggests that smaller or mid-sized stocks in the S&P 500 are outperforming the largest ones, indicating broader market participation and potentially healthier overall market conditions. Conversely, when the ratio falls, it implies that a few mega-cap stocks are driving the market's gains, which can signal increased concentration risk or a narrower rally. For example, RSP provides more diversified exposure by reducing concentration in large-cap stocks, while VOO reflects the dominance of top-weighted holdings. Investors might monitor this ratio to gauge market sentiment, with RSP historically showing higher expense ratios (around 0.20%) compared to VOO's lower fees (about 0.03%), but offering potentially better risk-adjusted returns in certain environments.1.6秒
오픈 소스 스크립트
트레이딩뷰의 진정한 정신에 따라, 이 스크립트의 작성자는 이를 오픈소스로 공개하여 트레이더들이 기능을 검토하고 검증할 수 있도록 했습니다. 작성자에게 찬사를 보냅니다! 이 코드는 무료로 사용할 수 있지만, 코드를 재게시하는 경우 하우스 룰이 적용된다는 점을 기억하세요.
면책사항
해당 정보와 게시물은 금융, 투자, 트레이딩 또는 기타 유형의 조언이나 권장 사항으로 간주되지 않으며, 트레이딩뷰에서 제공하거나 보증하는 것이 아닙니다. 자세한 내용은 이용 약관을 참조하세요.
오픈 소스 스크립트
트레이딩뷰의 진정한 정신에 따라, 이 스크립트의 작성자는 이를 오픈소스로 공개하여 트레이더들이 기능을 검토하고 검증할 수 있도록 했습니다. 작성자에게 찬사를 보냅니다! 이 코드는 무료로 사용할 수 있지만, 코드를 재게시하는 경우 하우스 룰이 적용된다는 점을 기억하세요.
면책사항
해당 정보와 게시물은 금융, 투자, 트레이딩 또는 기타 유형의 조언이나 권장 사항으로 간주되지 않으며, 트레이딩뷰에서 제공하거나 보증하는 것이 아닙니다. 자세한 내용은 이용 약관을 참조하세요.