OPEN-SOURCE SCRIPT
업데이트됨 Horizontal Price Table
Overview:
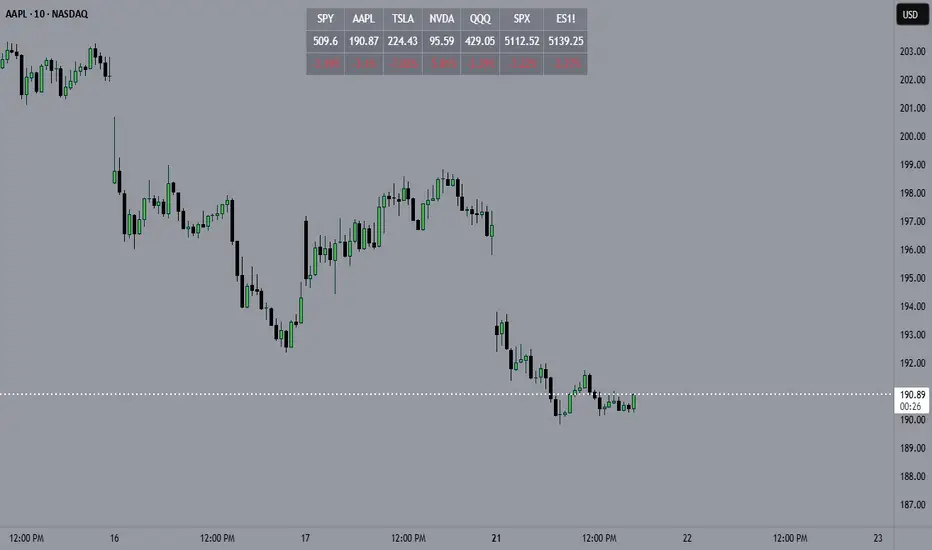
This script displays a dynamic price table on your chart, showing real-time prices and daily percentage changes for up to 7 user-defined tickers. You can customize both which tickers are shown and how many are visible, all through the settings panel.
How it works (Step-by-Step):
User-Defined Tickers:
The script provides input fields for up to 7 tickers using input.symbol(). You can track stocks, indexes, ETFs, crypto, or futures — anything supported by TradingView.
Choose How Many to Display:
An additional dropdown lets you choose how many of the 7 tickers to actually display (between 1 and 7). This gives you control over screen space and focus.
Market Data Fetching:
For each displayed ticker, the script fetches:
The current day’s closing price (close)
The previous day’s closing price (close[1])
This data is pulled using request.security() on the daily timeframe (1D).
% Change Calculation:
The script calculates the daily percentage change using:
(Current Price−Previous Close)/Previous Close×100(Current Price−Previous Close)/Previous Close×100
Cleaned Ticker Names:
Ticker symbols often include an exchange prefix like NASDAQ:AAPL. The script automatically removes anything before the colon (:), so only the clean symbol (e.g., AAPL) is shown in the table.
Table Display:
A visual table appears at the top-center of your chart, showing:
Customization:
Why Use This Script?
Tips:
This script displays a dynamic price table on your chart, showing real-time prices and daily percentage changes for up to 7 user-defined tickers. You can customize both which tickers are shown and how many are visible, all through the settings panel.
How it works (Step-by-Step):
User-Defined Tickers:
The script provides input fields for up to 7 tickers using input.symbol(). You can track stocks, indexes, ETFs, crypto, or futures — anything supported by TradingView.
Choose How Many to Display:
An additional dropdown lets you choose how many of the 7 tickers to actually display (between 1 and 7). This gives you control over screen space and focus.
Market Data Fetching:
For each displayed ticker, the script fetches:
The current day’s closing price (close)
The previous day’s closing price (close[1])
This data is pulled using request.security() on the daily timeframe (1D).
% Change Calculation:
The script calculates the daily percentage change using:
(Current Price−Previous Close)/Previous Close×100(Current Price−Previous Close)/Previous Close×100
Cleaned Ticker Names:
Ticker symbols often include an exchange prefix like NASDAQ:AAPL. The script automatically removes anything before the colon (:), so only the clean symbol (e.g., AAPL) is shown in the table.
Table Display:
A visual table appears at the top-center of your chart, showing:
- Row 1: Ticker symbol (cleaned)
- Row 2: Current price (rounded to 2 decimals)
- Row 3: Daily % change (green for gains, red for losses)
Customization:
- You can choose the background color of the table.
- Ticker names appear in white text with a gray background.
- % change is color-coded: green for positive, red for negative.
Why Use This Script?
- Track multiple tickers at once without leaving your chart.
- Clean, customizable layout.
- Useful for monitoring watchlists, portfolios, or related markets.
Tips:
- Combine this with your favorite indicators for a personalized dashboard.
- Works great on any chart or timeframe.
- Ensure the tickers entered are valid on TradingView (e.g., SPY, BTCUSD, NQ1!, etc.).
릴리즈 노트
Overview:This script displays a dynamic price table on your chart, showing real-time prices and daily percentage changes for up to 7 user-defined tickers. You can customize both which tickers are shown and how many are visible, all through the settings panel.
How it works (Step-by-Step):
User-Defined Tickers:
The script provides input fields for up to 7 tickers using input.symbol(). You can track stocks, indexes, ETFs, crypto, or futures — anything supported by TradingView.
Choose How Many to Display:
An additional dropdown lets you choose how many of the 7 tickers to actually display (between 1 and 7). This gives you control over screen space and focus.
Market Data Fetching:
For each displayed ticker, the script fetches:
The current day’s closing price (close)
The previous day’s closing price (close[1])
This data is pulled using request.security() on the daily timeframe (1D).
% Change Calculation:
The script calculates the daily percentage change using:
(Current Price−Previous Close)/Previous Close×100(Current Price−Previous Close)/Previous Close×100
Cleaned Ticker Names:
Ticker symbols often include an exchange prefix like NASDAQ:AAPL. The script automatically removes anything before the colon (:), so only the clean symbol (e.g., AAPL) is shown in the table.
Table Display:
A visual table appears at the top-center of your chart, showing:
- Row 1: Ticker symbol (cleaned)
- Row 2: Current price (rounded to 2 decimals)
- Row 3: Daily % change (green for gains, red for losses)
Customization:
- You can choose the background color of the table.
- Ticker names appear in white text with a gray background.
% change is color-coded: green for positive, red for negative.
Why Use This Script?
- Track multiple tickers at once without leaving your chart.
- Clean, customizable layout.
- Useful for monitoring watchlists, portfolios, or related markets.
Tips:
- Combine this with your favorite indicators for a personalized dashboard.
- Works great on any chart or timeframe.
- Ensure the tickers entered are valid on TradingView (e.g., SPY, BTCUSD, NQ1!, etc.).
오픈 소스 스크립트
트레이딩뷰의 진정한 정신에 따라, 이 스크립트의 작성자는 이를 오픈소스로 공개하여 트레이더들이 기능을 검토하고 검증할 수 있도록 했습니다. 작성자에게 찬사를 보냅니다! 이 코드는 무료로 사용할 수 있지만, 코드를 재게시하는 경우 하우스 룰이 적용된다는 점을 기억하세요.
면책사항
해당 정보와 게시물은 금융, 투자, 트레이딩 또는 기타 유형의 조언이나 권장 사항으로 간주되지 않으며, 트레이딩뷰에서 제공하거나 보증하는 것이 아닙니다. 자세한 내용은 이용 약관을 참조하세요.
오픈 소스 스크립트
트레이딩뷰의 진정한 정신에 따라, 이 스크립트의 작성자는 이를 오픈소스로 공개하여 트레이더들이 기능을 검토하고 검증할 수 있도록 했습니다. 작성자에게 찬사를 보냅니다! 이 코드는 무료로 사용할 수 있지만, 코드를 재게시하는 경우 하우스 룰이 적용된다는 점을 기억하세요.
면책사항
해당 정보와 게시물은 금융, 투자, 트레이딩 또는 기타 유형의 조언이나 권장 사항으로 간주되지 않으며, 트레이딩뷰에서 제공하거나 보증하는 것이 아닙니다. 자세한 내용은 이용 약관을 참조하세요.