OPEN-SOURCE SCRIPT
All-In-One: Moving Averages, Ichimoku cloud, Volume candle
Tired of install multiple basis indicators? This indicator allows you to install only one but you will have all basis indicators for your chart. Currently, it includes the following
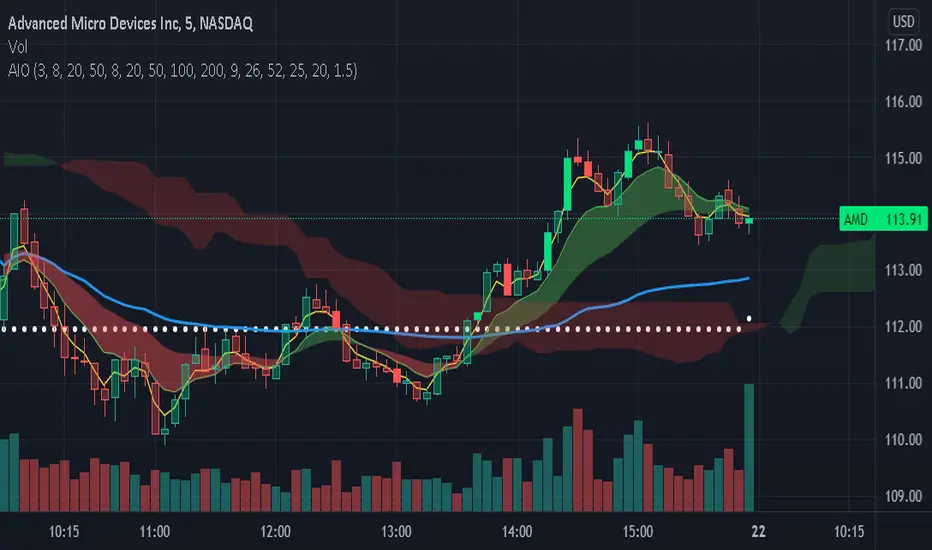
This script is particularly helpful for short timeframe chart, like M5. While it can show EMA or SAM for current time frame (up to 4 lines, user can change the length period for each lines to suit user's needs), it does plot up to 5 daily SMA lines. Default settings are for 8, 20, 50, 100, 200 SMA. The lines can be show or not be shown by the choice of user. Volume Weighted Average Price (VWAP), a technical analysis tool used to measure the average price weighted by volume, is also available in this indication.
In addition, this indicator can show two clouds: The first one is the EMA (or SMA) cloud, which plot the region between two EMA (or SMA) lines (the second and the third) of current timeframe, the second one is the Ichimoku cloud (the details of which can be found here tradingview.com/support/solutions/43000589152-ichimoku-cloud/).
The last feature is the Volume candle indicator. This indicator will highlight the candle with volume higher than volume threshold times of current simple moving average of the volume. The default setting is 1.5 * 20 period moving average of volume.
Even though this indicator has many different indicators in it, user can easily to turn off any of them.
If you have any unused tradingview coin, Comment with Cheer to support my work.
- Daily moving averages: Include 5 SMA lines
- Current timeframe moving averages: Include 4 EMA or SMA lines
- VWAP
- EMA (or SMA ) cloud, filled between EMA ( SMA ) #2 and #3 of current timeframe
- Ichimoku cloud
- Volume candle: Candle with high volume will be highlighted
This script is particularly helpful for short timeframe chart, like M5. While it can show EMA or SAM for current time frame (up to 4 lines, user can change the length period for each lines to suit user's needs), it does plot up to 5 daily SMA lines. Default settings are for 8, 20, 50, 100, 200 SMA. The lines can be show or not be shown by the choice of user. Volume Weighted Average Price (VWAP), a technical analysis tool used to measure the average price weighted by volume, is also available in this indication.
In addition, this indicator can show two clouds: The first one is the EMA (or SMA) cloud, which plot the region between two EMA (or SMA) lines (the second and the third) of current timeframe, the second one is the Ichimoku cloud (the details of which can be found here tradingview.com/support/solutions/43000589152-ichimoku-cloud/).
The last feature is the Volume candle indicator. This indicator will highlight the candle with volume higher than volume threshold times of current simple moving average of the volume. The default setting is 1.5 * 20 period moving average of volume.
Even though this indicator has many different indicators in it, user can easily to turn off any of them.
If you have any unused tradingview coin, Comment with Cheer to support my work.
오픈 소스 스크립트
진정한 트레이딩뷰 정신에 따라 이 스크립트 작성자는 트레이더가 기능을 검토하고 검증할 수 있도록 오픈소스로 공개했습니다. 작성자에게 찬사를 보냅니다! 무료로 사용할 수 있지만 코드를 다시 게시할 경우 하우스 룰이 적용된다는 점을 기억하세요.
면책사항
이 정보와 게시물은 TradingView에서 제공하거나 보증하는 금융, 투자, 거래 또는 기타 유형의 조언이나 권고 사항을 의미하거나 구성하지 않습니다. 자세한 내용은 이용 약관을 참고하세요.
오픈 소스 스크립트
진정한 트레이딩뷰 정신에 따라 이 스크립트 작성자는 트레이더가 기능을 검토하고 검증할 수 있도록 오픈소스로 공개했습니다. 작성자에게 찬사를 보냅니다! 무료로 사용할 수 있지만 코드를 다시 게시할 경우 하우스 룰이 적용된다는 점을 기억하세요.
면책사항
이 정보와 게시물은 TradingView에서 제공하거나 보증하는 금융, 투자, 거래 또는 기타 유형의 조언이나 권고 사항을 의미하거나 구성하지 않습니다. 자세한 내용은 이용 약관을 참고하세요.