PROTECTED SOURCE SCRIPT
AllTheUpsTheresAlwaysDowns
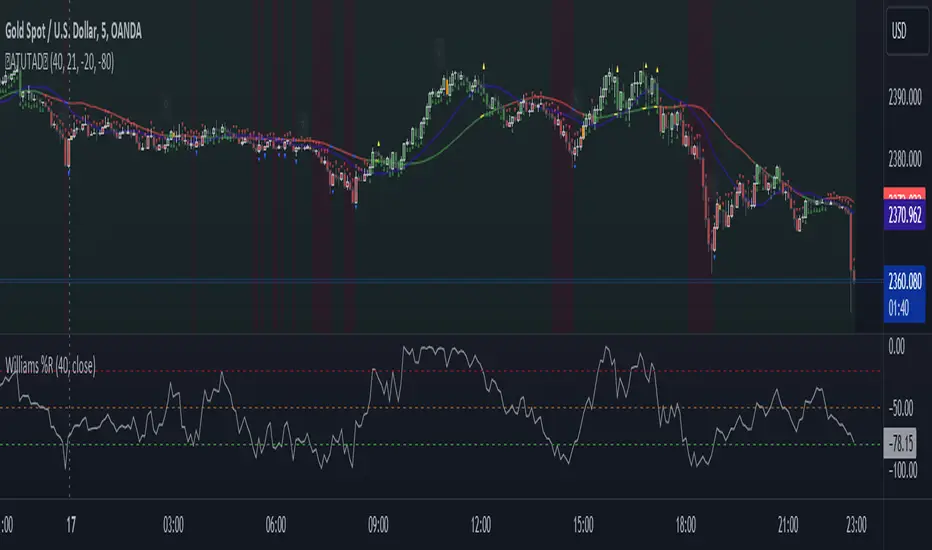
"AllTheUpsTheresAlwaysDowns" ☆ATUTAD☆ // w%r + ma indicator designed for forex trading.

This indicator combines the Williams %R, moving averages, and session tracking.
Key Inputs:
Williams%Range Period: Adjusts the sensitivity of the Williams %R calculation.
Moving Average Period: Defines the period for the moving average used in the indicator.
Overbought and Oversold Thresholds: Sets the thresholds for identifying overbought and oversold conditions.

Features:
Williams %R Calculation: Calculates the Williams %R, a momentum oscillator that measures overbought and oversold levels.
Moving Averages: Plots two moving averages to capitalize on and visualize trend direction.
Session Tracking: Identifies the start and end of trading sessions (Tokyo, London, New York) for better session-based analysis.
Signal Generation: Generates buy/sell signals based on Williams %R levels and moving average crossovers.
Color Coding: Visualizes color-coded bars and shapes to highlight different market conditions and signal types.
Alerts: For buy/sell signals and overbought/oversold conditions to prompt timely actions.

Usage Tips:
Interpret Signals: Trend direction through buy/sell signals and overbought/oversold trend,- reversal / breakout line conditions for potential trading opportunities.
Session Awareness: Take into account the trading sessions (Tokyo, London, New York) to move along with the market dynamics during different times of the day.
Confirmation: Use additional technical analysis tools to confirm signals before executing trades. For example the Williams Percetange Range indicator.
Risk Management: Trade with proper risk management strategies to avoid potential losses.


HappyTrading
This indicator combines the Williams %R, moving averages, and session tracking.
Key Inputs:
Williams%Range Period: Adjusts the sensitivity of the Williams %R calculation.
Moving Average Period: Defines the period for the moving average used in the indicator.
Overbought and Oversold Thresholds: Sets the thresholds for identifying overbought and oversold conditions.
Features:
Williams %R Calculation: Calculates the Williams %R, a momentum oscillator that measures overbought and oversold levels.
Moving Averages: Plots two moving averages to capitalize on and visualize trend direction.
Session Tracking: Identifies the start and end of trading sessions (Tokyo, London, New York) for better session-based analysis.
Signal Generation: Generates buy/sell signals based on Williams %R levels and moving average crossovers.
Color Coding: Visualizes color-coded bars and shapes to highlight different market conditions and signal types.
Alerts: For buy/sell signals and overbought/oversold conditions to prompt timely actions.
Usage Tips:
Interpret Signals: Trend direction through buy/sell signals and overbought/oversold trend,- reversal / breakout line conditions for potential trading opportunities.
Session Awareness: Take into account the trading sessions (Tokyo, London, New York) to move along with the market dynamics during different times of the day.
Confirmation: Use additional technical analysis tools to confirm signals before executing trades. For example the Williams Percetange Range indicator.
Risk Management: Trade with proper risk management strategies to avoid potential losses.
HappyTrading
보호된 스크립트입니다
이 스크립트는 비공개 소스로 게시됩니다. 하지만 이를 자유롭게 제한 없이 사용할 수 있습니다 – 자세한 내용은 여기에서 확인하세요.
면책사항
해당 정보와 게시물은 금융, 투자, 트레이딩 또는 기타 유형의 조언이나 권장 사항으로 간주되지 않으며, 트레이딩뷰에서 제공하거나 보증하는 것이 아닙니다. 자세한 내용은 이용 약관을 참조하세요.
면책사항
해당 정보와 게시물은 금융, 투자, 트레이딩 또는 기타 유형의 조언이나 권장 사항으로 간주되지 않으며, 트레이딩뷰에서 제공하거나 보증하는 것이 아닙니다. 자세한 내용은 이용 약관을 참조하세요.