INVITE-ONLY SCRIPT
업데이트됨 Market Breadth Ratio+ [Pt]
This is a + version of my original Market Breadth Ratio Indicator
https://www.tradingview.com/script/5YFNhX0V-Market-Breadth-Ratio-Pt/
DESCRIPTION
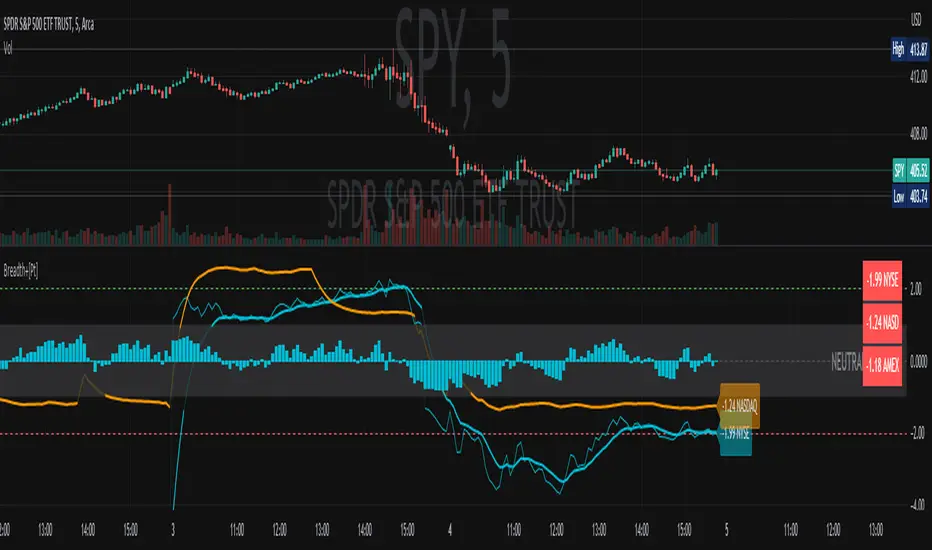
The Market Breadth Ratio+ [Pt] indicator is a tool that can help traders gain a more comprehensive understanding of market breadth by providing a ratio between Up volume (UVOL) and Down volume (DVOL).
While the VOLD indicator provides a straightforward measure of the difference between UVOL and DVOL, it doesn't account for the rate of change. The Market Breadth Ratio+ [Pt] indicator, on the other hand, takes the rate of change into account, providing a plot line that is easier to interpret and understand.
The Up Volume vs Down Volume Ratios measure the strength of buying versus selling pressure in the market. A ratio greater than 1 indicates that there is more buying pressure, while a ratio less than -1 indicates more selling pressure. The ratio is calculated by dividing the total volume of stocks that closed up on the day by the total volume of stocks that closed down.
|| ------------------------------------------------------------------------------------------------------------------------------------------------------------------------------------||
This script includes the following premium unique features.
1) Custom Moving Average line for Breadth Ratio line. There are a few MA type to choose from: SMA, EMA, RMA, WMA, VWMA, HMA
- This feature provide a smoother plot for better interpretation of the market trend
- MA crossovers can also be used as trend reversal signals
2) Breadth Strength Index (BSI)
- This graph shows the relative strength of the Breadth Ratio. This is a momentum based oscillator that measure the rate of change of the Breadth Ratio. It shows the strength and weakness in the Breadth Ratio plot.
- A bar close to 1 means the market is very strong in the Bullish direction, conversely, a bar close to -1 means the market is very weak, but very strong in the Bearish direction
- Above 0 shows Bullish strength
- Below 0 shows Bearish strength
3) Two display modes for Breadth Strength Index
- Histogram
- Line
- These can be combined to show different markets together, such as NYSE and NASDAQ
4) Custom Moving Average can be applied to the BSI
- This will provide smoother graph for easier interpretation
https://www.tradingview.com/x/xlAmlimI/
5) Aggregated Market Strength
- This feature combines the BSI of multiple markets, such as NYSE and NASDAQ, to provide a more comprehensive view of the overall US market. Often time, one of these indices will have a stronger 'pull' on the entire market. By observing the dominant color (of your choosing), you can see which index is pulling the market. And by trading the market that has the bigger pull, traders can leverage on the possible higher volatility for greater trade opportunities.
6) Custom Moving Average can be applied to the Aggregated Market Strength
- This will provide smoother graph for easier interpretation
https://www.tradingview.com/x/MatmShWP/
7) Show alternating trend colors on Aggregated Market Strength
- This provides an intuitive view of the market strength that's based on market breadth ratio
https://www.tradingview.com/x/8w4UYNiH/
https://www.tradingview.com/script/5YFNhX0V-Market-Breadth-Ratio-Pt/
DESCRIPTION
The Market Breadth Ratio+ [Pt] indicator is a tool that can help traders gain a more comprehensive understanding of market breadth by providing a ratio between Up volume (UVOL) and Down volume (DVOL).
While the VOLD indicator provides a straightforward measure of the difference between UVOL and DVOL, it doesn't account for the rate of change. The Market Breadth Ratio+ [Pt] indicator, on the other hand, takes the rate of change into account, providing a plot line that is easier to interpret and understand.
The Up Volume vs Down Volume Ratios measure the strength of buying versus selling pressure in the market. A ratio greater than 1 indicates that there is more buying pressure, while a ratio less than -1 indicates more selling pressure. The ratio is calculated by dividing the total volume of stocks that closed up on the day by the total volume of stocks that closed down.
|| ------------------------------------------------------------------------------------------------------------------------------------------------------------------------------------||
This script includes the following premium unique features.
1) Custom Moving Average line for Breadth Ratio line. There are a few MA type to choose from: SMA, EMA, RMA, WMA, VWMA, HMA
- This feature provide a smoother plot for better interpretation of the market trend
- MA crossovers can also be used as trend reversal signals
2) Breadth Strength Index (BSI)
- This graph shows the relative strength of the Breadth Ratio. This is a momentum based oscillator that measure the rate of change of the Breadth Ratio. It shows the strength and weakness in the Breadth Ratio plot.
- A bar close to 1 means the market is very strong in the Bullish direction, conversely, a bar close to -1 means the market is very weak, but very strong in the Bearish direction
- Above 0 shows Bullish strength
- Below 0 shows Bearish strength
3) Two display modes for Breadth Strength Index
- Histogram
- Line
- These can be combined to show different markets together, such as NYSE and NASDAQ
4) Custom Moving Average can be applied to the BSI
- This will provide smoother graph for easier interpretation
https://www.tradingview.com/x/xlAmlimI/
5) Aggregated Market Strength
- This feature combines the BSI of multiple markets, such as NYSE and NASDAQ, to provide a more comprehensive view of the overall US market. Often time, one of these indices will have a stronger 'pull' on the entire market. By observing the dominant color (of your choosing), you can see which index is pulling the market. And by trading the market that has the bigger pull, traders can leverage on the possible higher volatility for greater trade opportunities.
6) Custom Moving Average can be applied to the Aggregated Market Strength
- This will provide smoother graph for easier interpretation
https://www.tradingview.com/x/MatmShWP/
7) Show alternating trend colors on Aggregated Market Strength
- This provides an intuitive view of the market strength that's based on market breadth ratio
https://www.tradingview.com/x/8w4UYNiH/
릴리즈 노트
◊ MInor Feature Updates- Added Data Table location options
- Added Data Table orientation options
- Added TICK Data option onto Data Table
초대 전용 스크립트
이 스크립트는 작성자가 승인한 사용자만 접근할 수 있습니다. 사용하려면 요청 후 승인을 받아야 하며, 일반적으로 결제 후에 허가가 부여됩니다. 자세한 내용은 아래 작성자의 안내를 따르거나 PtGambler에게 직접 문의하세요.
트레이딩뷰는 스크립트의 작동 방식을 충분히 이해하고 작성자를 완전히 신뢰하지 않는 이상, 해당 스크립트에 비용을 지불하거나 사용하는 것을 권장하지 않습니다. 커뮤니티 스크립트에서 무료 오픈소스 대안을 찾아보실 수도 있습니다.
작성자 지시 사항
DM or reach me through my channels.
Purchases / Subscriptions / Support - buymeacoffee.com/ptgambler
PayPal - paypal.me/PtGambler
You can reach me privately through my Discord Channel: discord.gg/WMQfaVGyQC
PayPal - paypal.me/PtGambler
You can reach me privately through my Discord Channel: discord.gg/WMQfaVGyQC
면책사항
해당 정보와 게시물은 금융, 투자, 트레이딩 또는 기타 유형의 조언이나 권장 사항으로 간주되지 않으며, 트레이딩뷰에서 제공하거나 보증하는 것이 아닙니다. 자세한 내용은 이용 약관을 참조하세요.