OPEN-SOURCE SCRIPT
Multi Moving Average with Customization
Core Functionality
The indicator allows you to display up to 5 different moving averages on your chart simultaneously. Each moving average can be fully customized with its own settings. You can choose between
1. Simple Moving Average (SMA),
2. Exponential Moving Average (EMA)
3. Weighted Moving Average (WMA) types
Multi-Timeframe Support
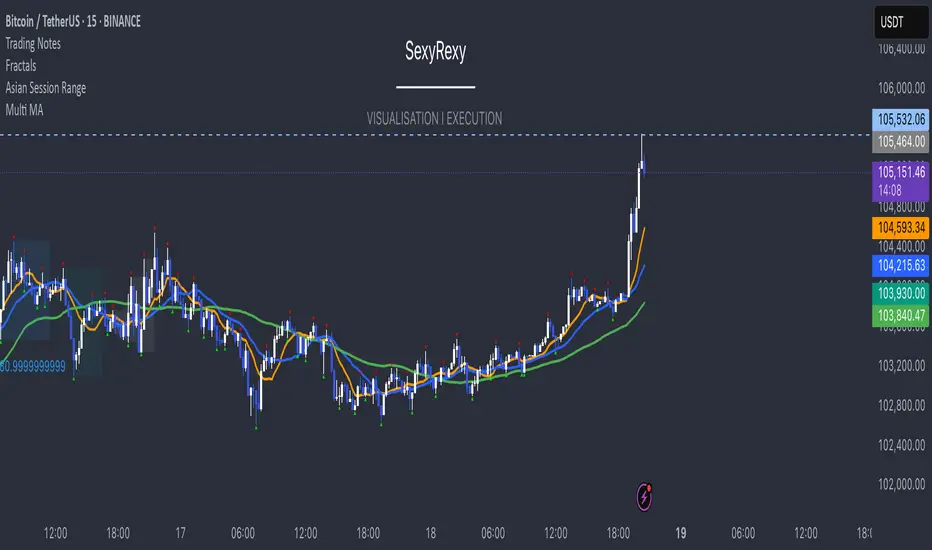
One standout feature is the ability to display higher timeframe moving averages on lower timeframe charts. For example, you can show a 200 EMA from the daily chart while viewing a 15-minute chart.
Advanced Visualization Features
The indicator includes several visualization enhancements:
1. MA Cloud - Creates a filled area between any two selected moving averages. The cloud automatically changes color based on which MA is on top - typically green when the faster MA is above (bullish) and red when below (bearish).
2. Golden/Death Cross Detection - Automatically detects and marks important MA crossover events:
* Golden Cross: When a shorter-term MA crosses above a longer-term MA (bullish signal)
* Death Cross: When a shorter-term MA crosses below a longer-term MA (bearish signal)
3. Trend Background - Colors the entire chart background based on whether price is above or below a specified MA, giving a clear visual indicator of the overall trend.
Alert System
The indicator can generate alerts when price crosses above or below any selected moving average. This feature is useful for automated trading signals or notifications, and can be configured to trigger once per bar.
Flexible Architecture
The code uses several programming techniques to maximize flexibility:
* Switch statements for selecting MA types and cloud values
* Conditional logic throughout the code
* Function abstraction for calculating MAs and handling multi-timeframe display
* String identifiers to select which MAs to use for cloud visualization
Unique Technical Aspects
1. The multi-timeframe plotting function solves the common problem of higher timeframe MAs looking distorted on lower timeframe charts.
2. The cloud feature uses string identifiers to select which MAs to use, allowing for any combination.
3. The indicator employs smart conditional logic to handle complex decision trees efficiently.
4. Every visual aspect (colors, line widths, display conditions) is customizable through the settings.
This indicator combines multiple technical analysis tools into a single, highly configurable package that can adapt to different trading styles and timeframes. Its ability to correctly display higher timeframe MAs on lower timeframe charts makes it particularly valuable for traders who analyze multiple timeframes simultaneously.
The indicator allows you to display up to 5 different moving averages on your chart simultaneously. Each moving average can be fully customized with its own settings. You can choose between
1. Simple Moving Average (SMA),
2. Exponential Moving Average (EMA)
3. Weighted Moving Average (WMA) types
Multi-Timeframe Support
One standout feature is the ability to display higher timeframe moving averages on lower timeframe charts. For example, you can show a 200 EMA from the daily chart while viewing a 15-minute chart.
Advanced Visualization Features
The indicator includes several visualization enhancements:
1. MA Cloud - Creates a filled area between any two selected moving averages. The cloud automatically changes color based on which MA is on top - typically green when the faster MA is above (bullish) and red when below (bearish).
2. Golden/Death Cross Detection - Automatically detects and marks important MA crossover events:
* Golden Cross: When a shorter-term MA crosses above a longer-term MA (bullish signal)
* Death Cross: When a shorter-term MA crosses below a longer-term MA (bearish signal)
3. Trend Background - Colors the entire chart background based on whether price is above or below a specified MA, giving a clear visual indicator of the overall trend.
Alert System
The indicator can generate alerts when price crosses above or below any selected moving average. This feature is useful for automated trading signals or notifications, and can be configured to trigger once per bar.
Flexible Architecture
The code uses several programming techniques to maximize flexibility:
* Switch statements for selecting MA types and cloud values
* Conditional logic throughout the code
* Function abstraction for calculating MAs and handling multi-timeframe display
* String identifiers to select which MAs to use for cloud visualization
Unique Technical Aspects
1. The multi-timeframe plotting function solves the common problem of higher timeframe MAs looking distorted on lower timeframe charts.
2. The cloud feature uses string identifiers to select which MAs to use, allowing for any combination.
3. The indicator employs smart conditional logic to handle complex decision trees efficiently.
4. Every visual aspect (colors, line widths, display conditions) is customizable through the settings.
This indicator combines multiple technical analysis tools into a single, highly configurable package that can adapt to different trading styles and timeframes. Its ability to correctly display higher timeframe MAs on lower timeframe charts makes it particularly valuable for traders who analyze multiple timeframes simultaneously.
오픈 소스 스크립트
트레이딩뷰의 진정한 정신에 따라, 이 스크립트의 작성자는 이를 오픈소스로 공개하여 트레이더들이 기능을 검토하고 검증할 수 있도록 했습니다. 작성자에게 찬사를 보냅니다! 이 코드는 무료로 사용할 수 있지만, 코드를 재게시하는 경우 하우스 룰이 적용된다는 점을 기억하세요.
면책사항
해당 정보와 게시물은 금융, 투자, 트레이딩 또는 기타 유형의 조언이나 권장 사항으로 간주되지 않으며, 트레이딩뷰에서 제공하거나 보증하는 것이 아닙니다. 자세한 내용은 이용 약관을 참조하세요.
오픈 소스 스크립트
트레이딩뷰의 진정한 정신에 따라, 이 스크립트의 작성자는 이를 오픈소스로 공개하여 트레이더들이 기능을 검토하고 검증할 수 있도록 했습니다. 작성자에게 찬사를 보냅니다! 이 코드는 무료로 사용할 수 있지만, 코드를 재게시하는 경우 하우스 룰이 적용된다는 점을 기억하세요.
면책사항
해당 정보와 게시물은 금융, 투자, 트레이딩 또는 기타 유형의 조언이나 권장 사항으로 간주되지 않으며, 트레이딩뷰에서 제공하거나 보증하는 것이 아닙니다. 자세한 내용은 이용 약관을 참조하세요.