PROTECTED SOURCE SCRIPT
Intraday Zones & Levels - Support & Resistance
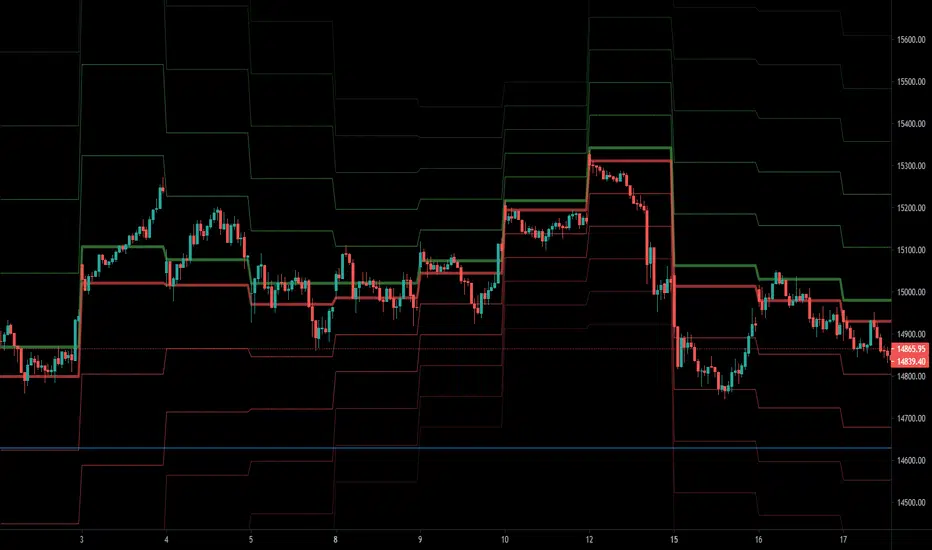
I use this indicator to mark levels and mathematically categorize my 15mins chart into smaller trading zones. You can view these as Support and Resistance levels as well, however, the main function is to visually divide the chart on the basis of previous days' price movements.
- Levels are calculated based on the Average % Change per Day for the last 5 Days. Calculations use Daily open Value for the last 5 days & % Change using current open Value.
- Entry Levels ( Bullish and Bearish ) mathematically divide the charts into 2 zones and can be used to determine the nature of the stock movement during that day.
- Weekly and Yearly Open Prices are also plotted on the chart as reference levels.
보호된 스크립트입니다
이 스크립트는 비공개 소스로 게시됩니다. 하지만 이를 자유롭게 제한 없이 사용할 수 있습니다 – 자세한 내용은 여기에서 확인하세요.
-
Garey
Whatsapp - +91 9999 504 500
Garey
Whatsapp - +91 9999 504 500
면책사항
해당 정보와 게시물은 금융, 투자, 트레이딩 또는 기타 유형의 조언이나 권장 사항으로 간주되지 않으며, 트레이딩뷰에서 제공하거나 보증하는 것이 아닙니다. 자세한 내용은 이용 약관을 참조하세요.
보호된 스크립트입니다
이 스크립트는 비공개 소스로 게시됩니다. 하지만 이를 자유롭게 제한 없이 사용할 수 있습니다 – 자세한 내용은 여기에서 확인하세요.
-
Garey
Whatsapp - +91 9999 504 500
Garey
Whatsapp - +91 9999 504 500
면책사항
해당 정보와 게시물은 금융, 투자, 트레이딩 또는 기타 유형의 조언이나 권장 사항으로 간주되지 않으며, 트레이딩뷰에서 제공하거나 보증하는 것이 아닙니다. 자세한 내용은 이용 약관을 참조하세요.