OPEN-SOURCE SCRIPT
업데이트됨 RSI Scalping Gold (XAUUSD) - v5
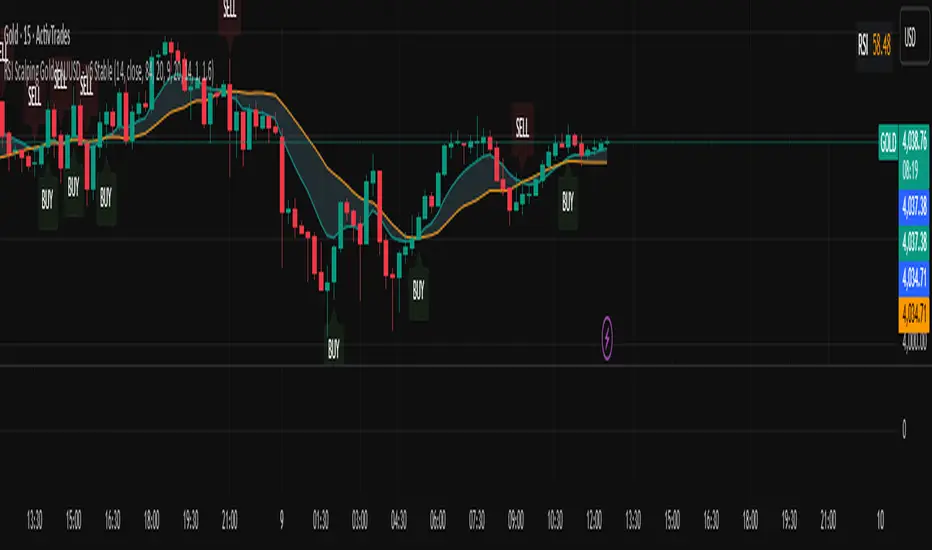
Displays the EMA9 and SMA20 to identify the trend.
Colors the area between the two averages to better visualize the equilibrium zone.
Displays green (buy) and red (sell) arrows aligned with the candles.
The RSI is calculated but hidden from the main chart (you can activate it by checking “Display on chart” in the settings).
Colors the area between the two averages to better visualize the equilibrium zone.
Displays green (buy) and red (sell) arrows aligned with the candles.
The RSI is calculated but hidden from the main chart (you can activate it by checking “Display on chart” in the settings).
릴리즈 노트
What this version adds:Visible and offset arrows and labels → clearer across all timeframes.
SL/TP directly on the label for each signal.
EMA9/SMA20 zone with transparent sky blue background.
Automatic BUY/SELL alerts as soon as the signal appears.
RSI chart updated in real time.
오픈 소스 스크립트
진정한 트레이딩뷰 정신에 따라 이 스크립트 작성자는 트레이더가 기능을 검토하고 검증할 수 있도록 오픈소스로 공개했습니다. 작성자에게 찬사를 보냅니다! 무료로 사용할 수 있지만 코드를 다시 게시할 경우 하우스 룰이 적용된다는 점을 기억하세요.
면책사항
이 정보와 게시물은 TradingView에서 제공하거나 보증하는 금융, 투자, 거래 또는 기타 유형의 조언이나 권고 사항을 의미하거나 구성하지 않습니다. 자세한 내용은 이용 약관을 참고하세요.
오픈 소스 스크립트
진정한 트레이딩뷰 정신에 따라 이 스크립트 작성자는 트레이더가 기능을 검토하고 검증할 수 있도록 오픈소스로 공개했습니다. 작성자에게 찬사를 보냅니다! 무료로 사용할 수 있지만 코드를 다시 게시할 경우 하우스 룰이 적용된다는 점을 기억하세요.
면책사항
이 정보와 게시물은 TradingView에서 제공하거나 보증하는 금융, 투자, 거래 또는 기타 유형의 조언이나 권고 사항을 의미하거나 구성하지 않습니다. 자세한 내용은 이용 약관을 참고하세요.