OPEN-SOURCE SCRIPT
업데이트됨 Median of Means Estimator
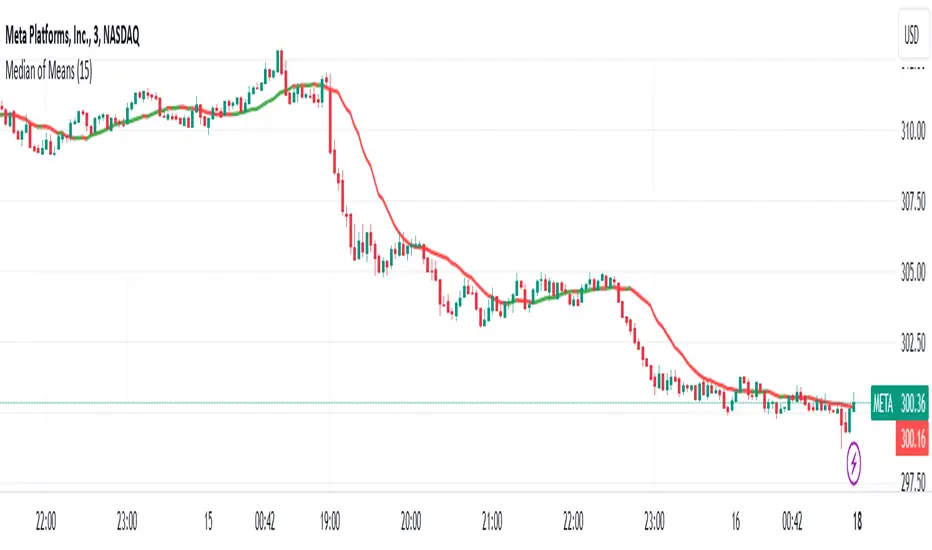
Median of Means (MoM) is a measure of central tendency like mean (average) and median. However, it could be a better and robust estimator of central tendency when the data is not normal, asymmetric, have fat tails (like stock price data) and have outliers. The MoM can be used as a robust trend following tool and in other derived indicators.
Median of means (MoM) is calculated as follows, the MoM estimator shuffles the "n" data points and then splits them into k groups of m data points (n= k*m). It then computes the Arithmetic Mean of each group (k). Finally, it calculate the median over the resulting k Arithmetic Means. This technique diminishes the effect that outliers have on the final estimation by splitting the data and only considering the median of the resulting sub-estimations. This preserves the overall trend despite the data shuffle.
Below is an example to illustrate the advantages of MoM
Set A Set B Set C
3 4 4
3 4 4
3 5 5
3 5 5
4 5 5
4 5 5
5 5 5
5 5 5
6 6 8
6 6 8
7 7 10
7 7 15
8 8 40
9 9 50
10 100 100
Median 5 5 5
Mean 5.5 12.1 17.9
MoM 5.7 6.0 17.3
For all three sets the median is the same, though set A and B are the same except for one outlier in set B (100) it skews the mean but the median is resilient. However, in set C the group has several high values despite that the median is not responsive and still give 5 as the central tendency of the group, but the median of means is a value of 17.3 which is very close to the group mean 17.9. In all three cases (set A, B and C) the MoM provides a better snapshot of the central tendency of the group. Note: The MoM is dependent on the way we split the data initially and the value might slightly vary when the randomization is done sevral time and the resulting value can give the confidence interval of the MoM estimator.
릴리즈 노트
Updated default length to 15 use lengths which are multiples of 3. 릴리즈 노트
minor update 오픈 소스 스크립트
트레이딩뷰의 진정한 정신에 따라, 이 스크립트의 작성자는 이를 오픈소스로 공개하여 트레이더들이 기능을 검토하고 검증할 수 있도록 했습니다. 작성자에게 찬사를 보냅니다! 이 코드는 무료로 사용할 수 있지만, 코드를 재게시하는 경우 하우스 룰이 적용된다는 점을 기억하세요.
면책사항
해당 정보와 게시물은 금융, 투자, 트레이딩 또는 기타 유형의 조언이나 권장 사항으로 간주되지 않으며, 트레이딩뷰에서 제공하거나 보증하는 것이 아닙니다. 자세한 내용은 이용 약관을 참조하세요.
오픈 소스 스크립트
트레이딩뷰의 진정한 정신에 따라, 이 스크립트의 작성자는 이를 오픈소스로 공개하여 트레이더들이 기능을 검토하고 검증할 수 있도록 했습니다. 작성자에게 찬사를 보냅니다! 이 코드는 무료로 사용할 수 있지만, 코드를 재게시하는 경우 하우스 룰이 적용된다는 점을 기억하세요.
면책사항
해당 정보와 게시물은 금융, 투자, 트레이딩 또는 기타 유형의 조언이나 권장 사항으로 간주되지 않으며, 트레이딩뷰에서 제공하거나 보증하는 것이 아닙니다. 자세한 내용은 이용 약관을 참조하세요.