OPEN-SOURCE SCRIPT
업데이트됨 Bull Market Support Band (20w SMA, 21w EMA)
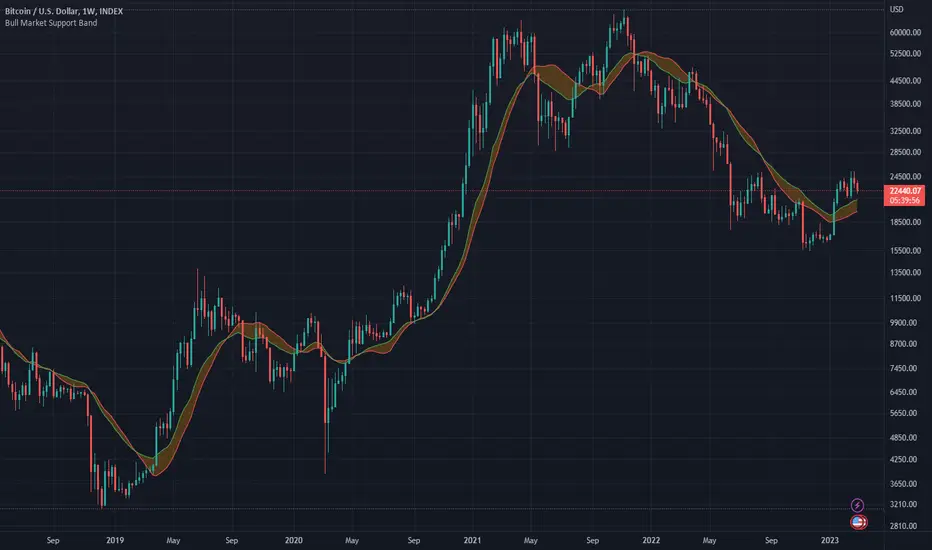
This moving average indicator is a bull market support band. It's significance comes from the previous bull runs where the price was bouncing off or riding from a distance the support band until the end of the market cycle. For example, during the 2017 bull run, Bitcoin had several 30-40% corrections to the support band.
The green line represents the 20 weeks simple moving average and the red line represents the 21 weeks exponential moving average. The best way to read the current value is to look at the weekly chart, but any time frame will display the same values.
The green line represents the 20 weeks simple moving average and the red line represents the 21 weeks exponential moving average. The best way to read the current value is to look at the weekly chart, but any time frame will display the same values.
릴리즈 노트
Smooth lines on non-weekly timeframes.릴리즈 노트
Removed deprecated "color" attribute in "fill" function and changed "color" attribute accordingly.릴리즈 노트
Fixed a bug where changing the indicator timeframe does not change the lengths of the moving averages. 릴리즈 노트
Bumped the version to v5.릴리즈 노트
Fixed a bug where there is a gap between the latest indicator data and the chart's latest data on timeframes lower than weekly.릴리즈 노트
Reverted last big fix since it is removed multi timeframe functionality.릴리즈 노트
Same as above오픈 소스 스크립트
진정한 트레이딩뷰 정신에 따라 이 스크립트 작성자는 트레이더가 기능을 검토하고 검증할 수 있도록 오픈소스로 공개했습니다. 작성자에게 찬사를 보냅니다! 무료로 사용할 수 있지만 코드를 다시 게시할 경우 하우스 룰이 적용된다는 점을 기억하세요.
면책사항
이 정보와 게시물은 TradingView에서 제공하거나 보증하는 금융, 투자, 거래 또는 기타 유형의 조언이나 권고 사항을 의미하거나 구성하지 않습니다. 자세한 내용은 이용 약관을 참고하세요.
오픈 소스 스크립트
진정한 트레이딩뷰 정신에 따라 이 스크립트 작성자는 트레이더가 기능을 검토하고 검증할 수 있도록 오픈소스로 공개했습니다. 작성자에게 찬사를 보냅니다! 무료로 사용할 수 있지만 코드를 다시 게시할 경우 하우스 룰이 적용된다는 점을 기억하세요.
면책사항
이 정보와 게시물은 TradingView에서 제공하거나 보증하는 금융, 투자, 거래 또는 기타 유형의 조언이나 권고 사항을 의미하거나 구성하지 않습니다. 자세한 내용은 이용 약관을 참고하세요.