OPEN-SOURCE SCRIPT
Volume Crossover Strategy
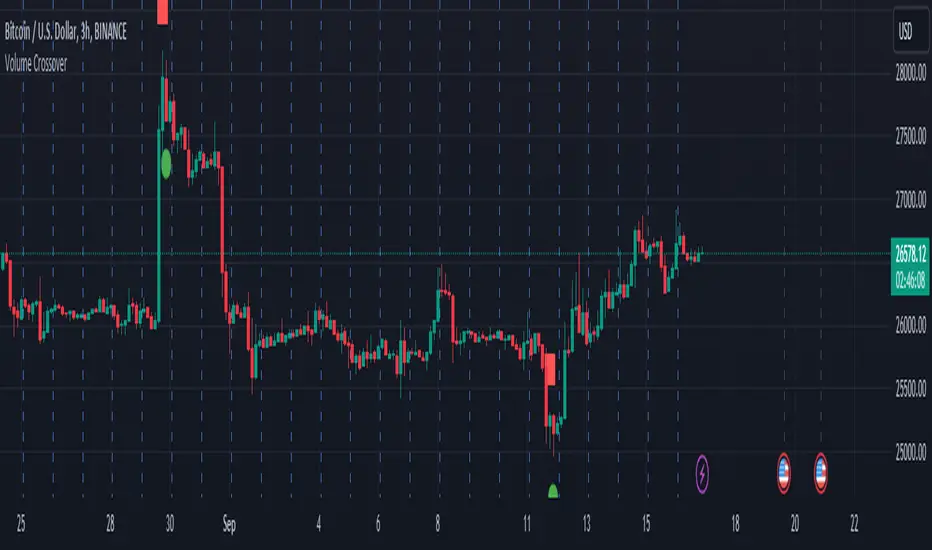
This script shows us the strength and acceleration of the trend, not the direction. ! . The indicator is built on the collision of two volumes (the collision of one-hour and four-hour volumes), where as a result one upward arrow shows us (acceleration, pressing the gas on the pedal), and the downward one shows deceleration (i.e. braking).
Recommendation: Be sure to attach:
a) any trend direction indicator (SMA, EMA), through which we will have an idea where the market is going and going:
b) volatility indicator
c) AD accumulation distribution (let's have a real picture, is there a buying or selling trend)
It is suitable for a one-hour timeframe
P.S. The script does not make any guarantee of profit, it is published only for the purpose of sharing my opinion about this strategy.
an hour ago
Comment:
The green signal is the start of the marathon, and the red signal is the end. For example, if the downward trend has ended (we can see it through the blue signal), it does not mean that the next marathon will necessarily be a reflected trend. It is not excluded that the next marathon will also develop on a downward trend...and therefore in the opposite case as well..
오픈 소스 스크립트
트레이딩뷰의 진정한 정신에 따라, 이 스크립트의 작성자는 이를 오픈소스로 공개하여 트레이더들이 기능을 검토하고 검증할 수 있도록 했습니다. 작성자에게 찬사를 보냅니다! 이 코드는 무료로 사용할 수 있지만, 코드를 재게시하는 경우 하우스 룰이 적용된다는 점을 기억하세요.
면책사항
해당 정보와 게시물은 금융, 투자, 트레이딩 또는 기타 유형의 조언이나 권장 사항으로 간주되지 않으며, 트레이딩뷰에서 제공하거나 보증하는 것이 아닙니다. 자세한 내용은 이용 약관을 참조하세요.
오픈 소스 스크립트
트레이딩뷰의 진정한 정신에 따라, 이 스크립트의 작성자는 이를 오픈소스로 공개하여 트레이더들이 기능을 검토하고 검증할 수 있도록 했습니다. 작성자에게 찬사를 보냅니다! 이 코드는 무료로 사용할 수 있지만, 코드를 재게시하는 경우 하우스 룰이 적용된다는 점을 기억하세요.
면책사항
해당 정보와 게시물은 금융, 투자, 트레이딩 또는 기타 유형의 조언이나 권장 사항으로 간주되지 않으며, 트레이딩뷰에서 제공하거나 보증하는 것이 아닙니다. 자세한 내용은 이용 약관을 참조하세요.