OPEN-SOURCE SCRIPT
Volume Chart
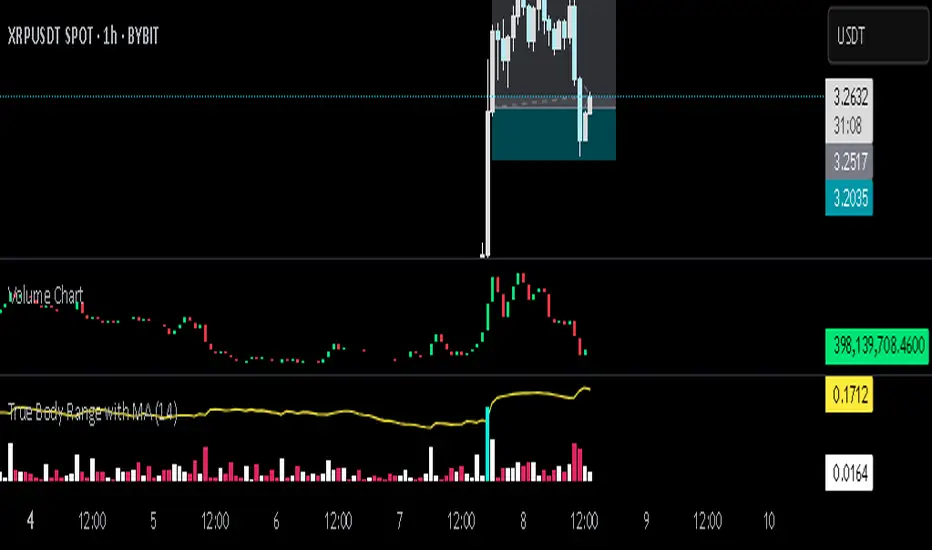
This Pine Script indicator, written in TradingView’s version 6, visualizes trading volume as a custom candlestick chart instead of a standard histogram. Rather than plotting volume bars, it constructs synthetic candles where each candle’s "open" is set to the previous candle’s "close" (stored in prevClose). The "close" of the synthetic candle moves upward by the volume value if the actual price candle was bullish (close > open) and downward by the volume value if it was bearish, with the "high" and "low" both fixed to the open to create a flat candle body line. This transforms volume into a price-like cumulative visual flow, color-coded green for bullish and red for bearish periods, allowing traders to intuitively track whether volume pressure is accumulating upward or downward over time, as though volume itself were moving like a market price series.
오픈 소스 스크립트
트레이딩뷰의 진정한 정신에 따라, 이 스크립트의 작성자는 이를 오픈소스로 공개하여 트레이더들이 기능을 검토하고 검증할 수 있도록 했습니다. 작성자에게 찬사를 보냅니다! 이 코드는 무료로 사용할 수 있지만, 코드를 재게시하는 경우 하우스 룰이 적용된다는 점을 기억하세요.
면책사항
해당 정보와 게시물은 금융, 투자, 트레이딩 또는 기타 유형의 조언이나 권장 사항으로 간주되지 않으며, 트레이딩뷰에서 제공하거나 보증하는 것이 아닙니다. 자세한 내용은 이용 약관을 참조하세요.
오픈 소스 스크립트
트레이딩뷰의 진정한 정신에 따라, 이 스크립트의 작성자는 이를 오픈소스로 공개하여 트레이더들이 기능을 검토하고 검증할 수 있도록 했습니다. 작성자에게 찬사를 보냅니다! 이 코드는 무료로 사용할 수 있지만, 코드를 재게시하는 경우 하우스 룰이 적용된다는 점을 기억하세요.
면책사항
해당 정보와 게시물은 금융, 투자, 트레이딩 또는 기타 유형의 조언이나 권장 사항으로 간주되지 않으며, 트레이딩뷰에서 제공하거나 보증하는 것이 아닙니다. 자세한 내용은 이용 약관을 참조하세요.