PROTECTED SOURCE SCRIPT
SZS Slow Stochastic
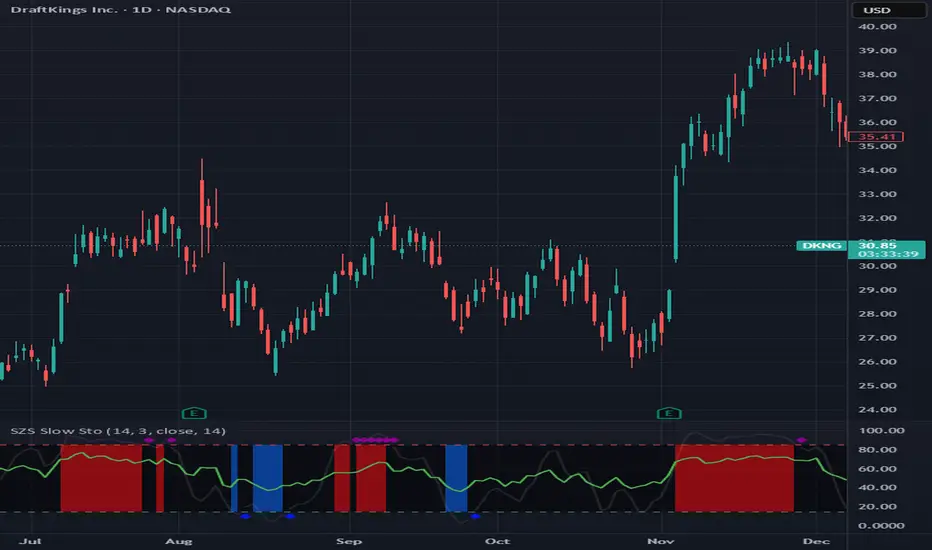
The SZS Slow Stochastic is a custom momentum indicator that blends the classic Slow Stochastic Oscillator with a dynamic RSI overlay and enhanced visual cues for overbought and oversold conditions.
This indicator helps identify potential trend reversals, momentum shifts, and exhaustion points in price movements.
Features
Slow Stochastic Calculation
Uses customizable %K and %D periods to measure momentum and potential turning points in price action.
%K Range: default 14
%D Period: default 3
Visual Extremes Highlighting
The plot line dynamically changes color to indicate:
🔴 Overbought Zone (%K ≥ 85)
🔵 Oversold Zone (%K ≤ 15)
⚪ Neutral Zone (between 15 and 85)
Diamond markers appear when %K exits the overbought/oversold regions to visually flag possible reversals.
RSI Momentum Overlay
The RSI (Relative Strength Index) is plotted alongside, colored based on recent momentum extremes:
🟢 RSI has touched above 75 within recent bars → bullish momentum bias
🔴 RSI has touched below 25 within recent bars → bearish momentum bias
Shaded Signal Zones
The area between the 85 and 15 levels is shaded according to current stochastic conditions:
Red shading → overbought pressure
Blue shading → oversold pressure
Alerts Ready
Upper and lower band crossing conditions are included for easy alert configuration.
Usage Tips
Look for color changes and diamond markers as potential early warnings of momentum reversals.
When both Stochastic and RSI show aligned signals (e.g. both indicating overbought or oversold), it strengthens the reversal or continuation signal.
Combine with price structure or volume indicators for higher confidence setups.
보호된 스크립트입니다
이 스크립트는 비공개 소스로 게시됩니다. 하지만 이를 자유롭게 제한 없이 사용할 수 있습니다 – 자세한 내용은 여기에서 확인하세요.
면책사항
해당 정보와 게시물은 금융, 투자, 트레이딩 또는 기타 유형의 조언이나 권장 사항으로 간주되지 않으며, 트레이딩뷰에서 제공하거나 보증하는 것이 아닙니다. 자세한 내용은 이용 약관을 참조하세요.
보호된 스크립트입니다
이 스크립트는 비공개 소스로 게시됩니다. 하지만 이를 자유롭게 제한 없이 사용할 수 있습니다 – 자세한 내용은 여기에서 확인하세요.
면책사항
해당 정보와 게시물은 금융, 투자, 트레이딩 또는 기타 유형의 조언이나 권장 사항으로 간주되지 않으며, 트레이딩뷰에서 제공하거나 보증하는 것이 아닙니다. 자세한 내용은 이용 약관을 참조하세요.