INVITE-ONLY SCRIPT
업데이트됨 Megalodon Pro Automated Shorter Term Trader
How to use?
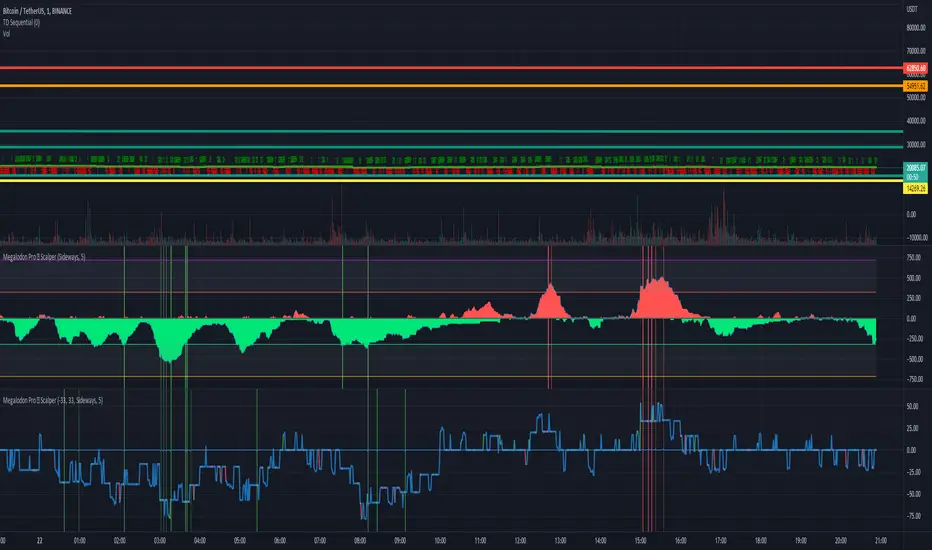
- Green cloud shows the total buy signals. Red cloud shows the total sell signals.
- Yellow line shows the difference between buy and sell signals. If yellow line is above 0, we have more SELL signals than BUY signals. If yellow line is below 0, we have more BUY signals than SELL signals.
- You should basically compare the red cloud with the green cloud to enter or exit in a trade.
- It should be used on shorter time frames. I recommend using 1 minute or 15 minute for better analysis.
- It prints Green for Buy - Orange for Strong Buy- Red for Sell - Purple for Strong Sell signals.
- This indicator basically looks for many different indicators' setups and shows you exactly what you need to know.
- You may also set alarms for 4 different signals including Buy - Strong Buy - Strong Sell - Sell
릴리즈 노트
Panel has been updated.릴리즈 노트
Panel issue has been fixed!릴리즈 노트
Better calculations.릴리즈 노트
New version of the pro trader.초대 전용 스크립트
이 스크립트는 작성자가 승인한 사용자만 접근할 수 있습니다. 사용하려면 요청 후 승인을 받아야 하며, 일반적으로 결제 후에 허가가 부여됩니다. 자세한 내용은 아래 작성자의 안내를 따르거나 MegalodonTrading에게 직접 문의하세요.
트레이딩뷰는 스크립트의 작동 방식을 충분히 이해하고 작성자를 완전히 신뢰하지 않는 이상, 해당 스크립트에 비용을 지불하거나 사용하는 것을 권장하지 않습니다. 커뮤니티 스크립트에서 무료 오픈소스 대안을 찾아보실 수도 있습니다.
작성자 지시 사항
New version of the pro.
Telegram Here t.me/bugrasukas
면책사항
해당 정보와 게시물은 금융, 투자, 트레이딩 또는 기타 유형의 조언이나 권장 사항으로 간주되지 않으며, 트레이딩뷰에서 제공하거나 보증하는 것이 아닙니다. 자세한 내용은 이용 약관을 참조하세요.
초대 전용 스크립트
이 스크립트는 작성자가 승인한 사용자만 접근할 수 있습니다. 사용하려면 요청 후 승인을 받아야 하며, 일반적으로 결제 후에 허가가 부여됩니다. 자세한 내용은 아래 작성자의 안내를 따르거나 MegalodonTrading에게 직접 문의하세요.
트레이딩뷰는 스크립트의 작동 방식을 충분히 이해하고 작성자를 완전히 신뢰하지 않는 이상, 해당 스크립트에 비용을 지불하거나 사용하는 것을 권장하지 않습니다. 커뮤니티 스크립트에서 무료 오픈소스 대안을 찾아보실 수도 있습니다.
작성자 지시 사항
New version of the pro.
Telegram Here t.me/bugrasukas
면책사항
해당 정보와 게시물은 금융, 투자, 트레이딩 또는 기타 유형의 조언이나 권장 사항으로 간주되지 않으며, 트레이딩뷰에서 제공하거나 보증하는 것이 아닙니다. 자세한 내용은 이용 약관을 참조하세요.