OPEN-SOURCE SCRIPT
업데이트됨 Stochastic Momentum multi. strategy
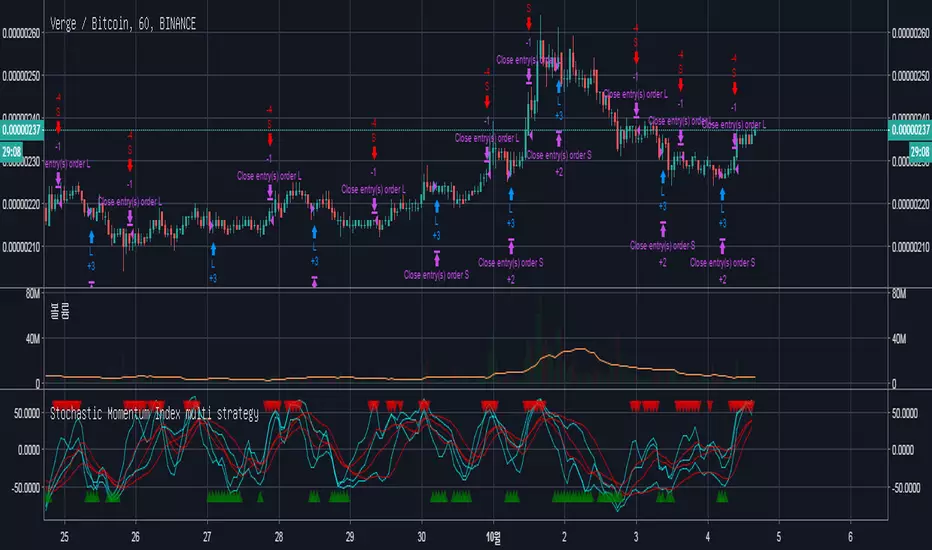
The Stochastic Momentum Index (Stoch MTM, SMI) is based on the Stochastic Oscillator. The difference is that the Stochastic Oscillator calculates where the close is relative to the high/low range, while the SMI calculates where the close is relative to the midpoint of the high/low range. The values of the SMI range from +100 to -100. When the close is greater than the midpoint, the SMI is above zero, when the close is less than than the midpoint, the SMI is below zero.
The SMI is interpreted the same way as the Stochastic Oscillator. Extreme high/low SMI values indicate overbought/oversold conditions. A buy signal is generated when the SMI rises above -50, or when it crosses above the signal line. A sell signal is generated when the SMI falls below +50, or when it crosses below the signal line. Also look for divergence with the price to signal the end of a trend or indicate a false trend.
The Stochastic Momentum Index was developed by William Blau and was introduced in his article in the January, 1993 issue of Technical Analysis of Stocks & Commodities magazine.
릴리즈 노트
added line draw on/off toggle.릴리즈 노트
message edited릴리즈 노트
added BB and MACD calculation for the accuracy.오픈 소스 스크립트
트레이딩뷰의 진정한 정신에 따라, 이 스크립트의 작성자는 이를 오픈소스로 공개하여 트레이더들이 기능을 검토하고 검증할 수 있도록 했습니다. 작성자에게 찬사를 보냅니다! 이 코드는 무료로 사용할 수 있지만, 코드를 재게시하는 경우 하우스 룰이 적용된다는 점을 기억하세요.
면책사항
해당 정보와 게시물은 금융, 투자, 트레이딩 또는 기타 유형의 조언이나 권장 사항으로 간주되지 않으며, 트레이딩뷰에서 제공하거나 보증하는 것이 아닙니다. 자세한 내용은 이용 약관을 참조하세요.
오픈 소스 스크립트
트레이딩뷰의 진정한 정신에 따라, 이 스크립트의 작성자는 이를 오픈소스로 공개하여 트레이더들이 기능을 검토하고 검증할 수 있도록 했습니다. 작성자에게 찬사를 보냅니다! 이 코드는 무료로 사용할 수 있지만, 코드를 재게시하는 경우 하우스 룰이 적용된다는 점을 기억하세요.
면책사항
해당 정보와 게시물은 금융, 투자, 트레이딩 또는 기타 유형의 조언이나 권장 사항으로 간주되지 않으며, 트레이딩뷰에서 제공하거나 보증하는 것이 아닙니다. 자세한 내용은 이용 약관을 참조하세요.