OPEN-SOURCE SCRIPT
SCTR's
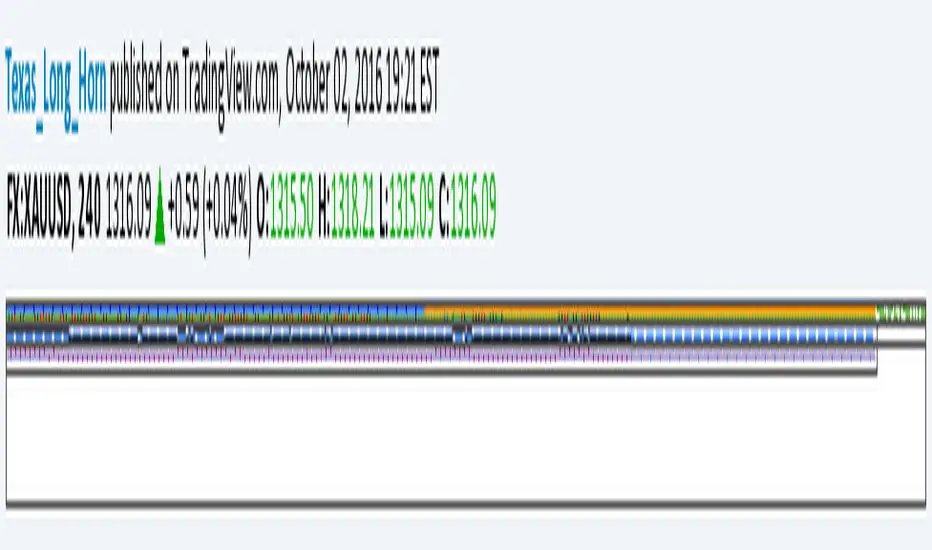
Inspired by John Murphy from Stock Charts, I build this indicator including the Long term, middle term and short term parameter. As John Murphy design, I kept the same proportion of the long, mid and short term as 60%, 30% and 10% but all could by modulated. This indicator is very simple and It range from 0.1 to 99.9, mean that full bullish is close of 99.9 and full bearish is close to 0.1. The 50's is the middle and mean there is no trend. As RSI, It could be interpreted as divergence or convergence pattern, and it's interesting to figure with RSI together to indentified the strongest of trend. You can learn more about SCTR's at stockcharts.com/school/doku.php?id=chart_school:technical_indicators:sctr
Enjoy this power full indicator
Enjoy this power full indicator
오픈 소스 스크립트
진정한 트레이딩뷰 정신에 따라 이 스크립트 작성자는 트레이더가 기능을 검토하고 검증할 수 있도록 오픈소스로 공개했습니다. 작성자에게 찬사를 보냅니다! 무료로 사용할 수 있지만 코드를 다시 게시할 경우 하우스 룰이 적용된다는 점을 기억하세요.
면책사항
이 정보와 게시물은 TradingView에서 제공하거나 보증하는 금융, 투자, 거래 또는 기타 유형의 조언이나 권고 사항을 의미하거나 구성하지 않습니다. 자세한 내용은 이용 약관을 참고하세요.
오픈 소스 스크립트
진정한 트레이딩뷰 정신에 따라 이 스크립트 작성자는 트레이더가 기능을 검토하고 검증할 수 있도록 오픈소스로 공개했습니다. 작성자에게 찬사를 보냅니다! 무료로 사용할 수 있지만 코드를 다시 게시할 경우 하우스 룰이 적용된다는 점을 기억하세요.
면책사항
이 정보와 게시물은 TradingView에서 제공하거나 보증하는 금융, 투자, 거래 또는 기타 유형의 조언이나 권고 사항을 의미하거나 구성하지 않습니다. 자세한 내용은 이용 약관을 참고하세요.