OPEN-SOURCE SCRIPT
업데이트됨 Multi Bollinger Bands with Background Fill
Multi Bollinger Bands with Background Fill
多組帶狀背景布林通道
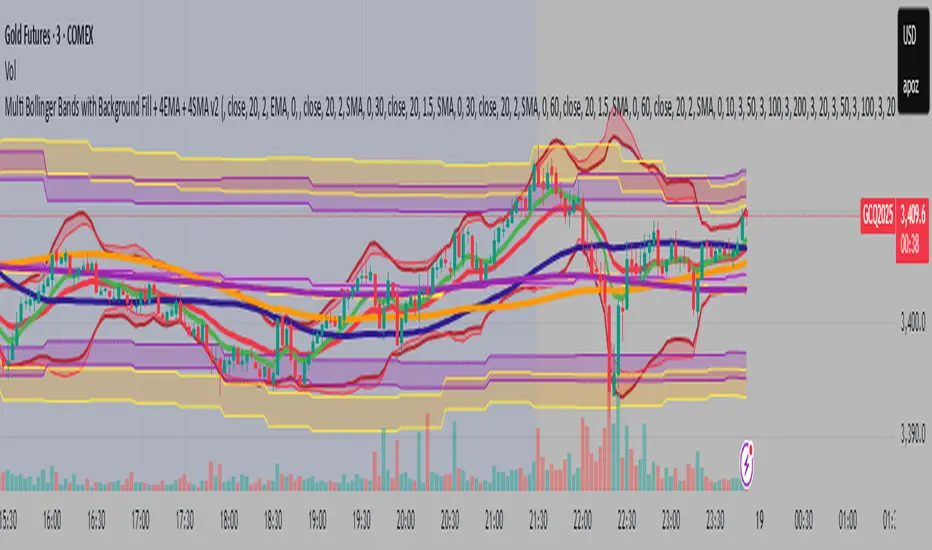
This indicator plots six independent Bollinger Bands channels on the price chart, each fully configurable with customizable period length, standard deviation, and colors for upper, lower, and middle bands. Users can choose to display or hide each channel and its middle band independently.
A distinctive feature of this tool is the option to enable colored background fills between paired Bollinger Bands (channels 1&2, 3&4, and 5&6) to visually highlight volatility zones, improving the clarity of price action and aiding in multi-timeframe volatility analysis.
Key Features:
Six independent Bollinger Bands channels with separate visibility toggles.
Adjustable length and standard deviation for each channel.
Option to display or hide the middle band (basis) for each channel.
Unique colored background fills between paired upper and lower bands for enhanced visual interpretation.
Custom color settings for each band and background for better differentiation.
This indicator is designed for traders looking for advanced multi-layered volatility insights and clearer visual guidance when analyzing price behavior across different timeframes. It is suitable for various trading strategies including trend analysis and volatility-based setups.
多組帶狀背景布林通道
This indicator plots six independent Bollinger Bands channels on the price chart, each fully configurable with customizable period length, standard deviation, and colors for upper, lower, and middle bands. Users can choose to display or hide each channel and its middle band independently.
A distinctive feature of this tool is the option to enable colored background fills between paired Bollinger Bands (channels 1&2, 3&4, and 5&6) to visually highlight volatility zones, improving the clarity of price action and aiding in multi-timeframe volatility analysis.
Key Features:
Six independent Bollinger Bands channels with separate visibility toggles.
Adjustable length and standard deviation for each channel.
Option to display or hide the middle band (basis) for each channel.
Unique colored background fills between paired upper and lower bands for enhanced visual interpretation.
Custom color settings for each band and background for better differentiation.
This indicator is designed for traders looking for advanced multi-layered volatility insights and clearer visual guidance when analyzing price behavior across different timeframes. It is suitable for various trading strategies including trend analysis and volatility-based setups.
릴리즈 노트
New FeaturesIndependent EMA / SMA Selection for Each Bollinger Band
Each of the 6 Bollinger Bands can now individually use either SMA or EMA as the basis line via a dropdown menu (switch type).
8 Fully Customizable Moving Averages
Added support for plotting:
4 EMAs and 4 SMAs, each with customizable:
Visibility (On/Off)
Length
Color
Line Width
릴리즈 노트
Bug fixed All in English
릴리즈 노트
Bug fixed릴리즈 노트
Based on TradingView official Bollinger Bands, 1. Additional Bollinger Band Calculation Methods
2. Timeframe Selection for Each Channel
오픈 소스 스크립트
트레이딩뷰의 진정한 정신에 따라, 이 스크립트의 작성자는 이를 오픈소스로 공개하여 트레이더들이 기능을 검토하고 검증할 수 있도록 했습니다. 작성자에게 찬사를 보냅니다! 이 코드는 무료로 사용할 수 있지만, 코드를 재게시하는 경우 하우스 룰이 적용된다는 점을 기억하세요.
면책사항
해당 정보와 게시물은 금융, 투자, 트레이딩 또는 기타 유형의 조언이나 권장 사항으로 간주되지 않으며, 트레이딩뷰에서 제공하거나 보증하는 것이 아닙니다. 자세한 내용은 이용 약관을 참조하세요.
오픈 소스 스크립트
트레이딩뷰의 진정한 정신에 따라, 이 스크립트의 작성자는 이를 오픈소스로 공개하여 트레이더들이 기능을 검토하고 검증할 수 있도록 했습니다. 작성자에게 찬사를 보냅니다! 이 코드는 무료로 사용할 수 있지만, 코드를 재게시하는 경우 하우스 룰이 적용된다는 점을 기억하세요.
면책사항
해당 정보와 게시물은 금융, 투자, 트레이딩 또는 기타 유형의 조언이나 권장 사항으로 간주되지 않으며, 트레이딩뷰에서 제공하거나 보증하는 것이 아닙니다. 자세한 내용은 이용 약관을 참조하세요.