INVITE-ONLY SCRIPT
SFC Smart Money - Volatility
In statistics, a normal distribution is a type of continuous probability distribution for a real-valued random variable. Normal distributions are important in statistics and are often used in the natural and social sciences to represent real-valued random variables whose distributions are not known.
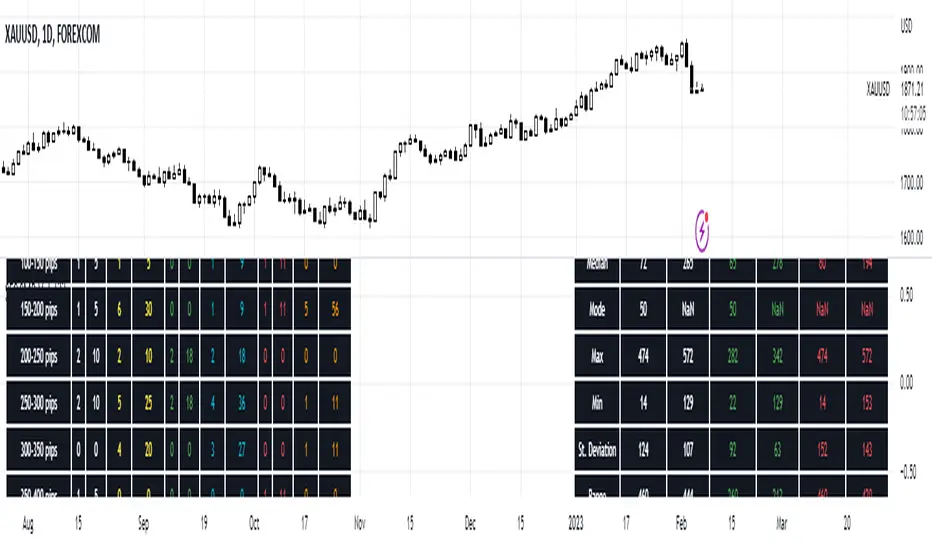
The indicator provide a deep statistic for the specified period. It calculate the normal distribution of all candles in the particular period, in order to measure the volatility and the probabilities. Also it separate bull from bear candles and calculate the normal distribution of each group. The calculations are mode based on open-open data and high-low data.
Volatility
Volatility is a statistical measure of the dispersion of returns for a given security or market index. In most cases, the higher the volatility , the riskier the security. Volatility is often measured from either the standard deviation or variance between returns from that same security or market index.
Volatility often refers to the amount of uncertainty or risk related to the size of changes in a security's value. A higher volatility means that a security's value can potentially be spread out over a larger range of values. This means that the price of the security can change dramatically over a short time period in either direction. A lower volatility means that a security's value does not fluctuate dramatically, and tends to be more steady.
While variance captures the dispersion of returns around the mean of an asset in general, volatility is a measure of that variance bounded by a specific period of time. Thus, we can report daily volatility , weekly, monthly, or annualized volatility .
This statistic gives very accurate information how the price moved in the past and what are normal movements and spikes. From this information, a future actions can be taken.
For better understanding, all data is calculated in pips.
Features:
- Mean - Mean is the one we are most used to, i.e. the average.
- Median -Sometimes, the data set values can have a few values which are at the extreme ends, and this might cause the mean of the data set to portray an incorrect picture.
Thus, we use the median, which gives the middle value of the sorted data set.
- Mode - In a given dataset, the mode will be the number which is occurring the most.
- Max - Maximum volatility for a given range.
- Min - Minimum volatility for a given range.
- Standard Deviation - The standard deviation tells us how far the value deviates from the mean.
- Range - Range simply gives the difference between the min and max values of the data set.
- ATR - Average True Range measures volatility, taking into account any gaps in the price movement.
- Normal Distribution - The basic premise is that given a range of observations, it is found that most of the values center around the mean and within one standard deviation
away from the mean.
- Probability - probability of outcomes.
We all know that the banks and professional traders do not trade with charts, but with different statistical methods, math. models and macroeconomics. This statistical indicator shows one of these methods.
It is recommended to use the indicator on daily timeframe . It also works on other timeframes, for example 1H for intraday analysis.
For more information how the normal distribution works, please search in internet.
초대 전용 스크립트
오써가 승인한 유저만 이 스크립트에 액세스할 수 있으며, 이를 위해서는 일반적으로 결제가 필요합니다. 이 스크립트를 즐겨찾기에 추가할 수는 있지만 오써에게 권한을 요청하여 권한을 얻은 뒤에야 쓸 수 있습니다 - 여기에서 자세히 알아보세요. 자세한 내용은 아래 오써의 안내를 따르거나 SerpentForexClub에게 직접 문의하세요.
트레이딩뷰는 스크립트 작성자를 완전히 신뢰하고 스크립트 작동 방식을 이해하지 않는 한 스크립트 비용을 지불하거나 사용하지 않는 것을 권장하지 않습니다. 무료 오픈소스 대체 스크립트는 커뮤니티 스크립트에서 찾을 수 있습니다.
작성자 지시 사항
Contact me through PM system.
경고: 액세스를 요청하기 앞서 초대 전용 스크립트에 대한 가이드를 읽어주세요.
면책사항
이 정보와 게시물은 TradingView에서 제공하거나 보증하는 금융, 투자, 거래 또는 기타 유형의 조언이나 권고 사항을 의미하거나 구성하지 않습니다. 자세한 내용은 이용 약관을 참고하세요.