OPEN-SOURCE SCRIPT
Last Freemans Ver1
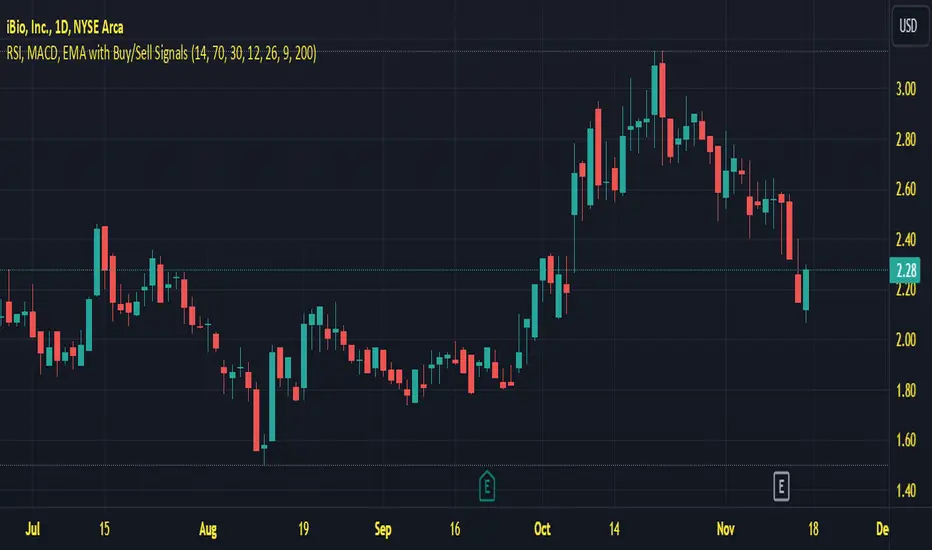
This script is a technical indicator for TradingView that combines three popular tools for analyzing price movements:
Relative Strength Index (RSI): This measures the momentum of recent price changes and indicates potential overbought or oversold conditions. The script allows you to adjust the RSI length (default 14) and define overbought (default 70) and oversold (default 30) levels.
Moving Average Convergence Divergence (MACD): This indicator helps identify trend direction and potential turning points. It uses two moving averages (fast and slow) and a signal line. The script lets you customize the lengths of the MACD lines (fast: 12, slow: 26, signal: 9).
Exponential Moving Average (EMA): This is a smoothing indicator used to identify the underlying trend by filtering out price noise. You can adjust the EMA length (default 200) in the script.
Additionally, the script generates Buy/Sell signals based on the following conditions:
Buy Signal:
MACD line crosses above the signal line (indicating a potential uptrend).
RSI is below the oversold level (suggesting room for price increase).
Closing price is below the EMA (potentially indicating a price pullback before an upswing).
Sell Signal:
MACD line crosses below the signal line (indicating a potential downtrend).
RSI is above the overbought level (suggesting potential for a price decrease).
Closing price is above the EMA (potentially indicating a price breakout before a decline).
Visualization:
The script plots the following on the chart:
RSI line (blue) with overbought and oversold levels as dashed lines (red and green, respectively).
MACD line (red) and signal line (blue).
EMA line (orange).
Green triangle up (below the bar) for Buy signals.
Red triangle down (above the bar) for Sell signals.
Important Note:
This script provides trading signals based on technical indicators, but keep in mind that these are not guaranteed predictions of future price movements. Always conduct your own research and consider other factors before making trading decisions.
오픈 소스 스크립트
트레이딩뷰의 진정한 정신에 따라, 이 스크립트의 작성자는 이를 오픈소스로 공개하여 트레이더들이 기능을 검토하고 검증할 수 있도록 했습니다. 작성자에게 찬사를 보냅니다! 이 코드는 무료로 사용할 수 있지만, 코드를 재게시하는 경우 하우스 룰이 적용된다는 점을 기억하세요.
면책사항
해당 정보와 게시물은 금융, 투자, 트레이딩 또는 기타 유형의 조언이나 권장 사항으로 간주되지 않으며, 트레이딩뷰에서 제공하거나 보증하는 것이 아닙니다. 자세한 내용은 이용 약관을 참조하세요.
오픈 소스 스크립트
트레이딩뷰의 진정한 정신에 따라, 이 스크립트의 작성자는 이를 오픈소스로 공개하여 트레이더들이 기능을 검토하고 검증할 수 있도록 했습니다. 작성자에게 찬사를 보냅니다! 이 코드는 무료로 사용할 수 있지만, 코드를 재게시하는 경우 하우스 룰이 적용된다는 점을 기억하세요.
면책사항
해당 정보와 게시물은 금융, 투자, 트레이딩 또는 기타 유형의 조언이나 권장 사항으로 간주되지 않으며, 트레이딩뷰에서 제공하거나 보증하는 것이 아닙니다. 자세한 내용은 이용 약관을 참조하세요.