OPEN-SOURCE SCRIPT
[S] Rolling Trendline
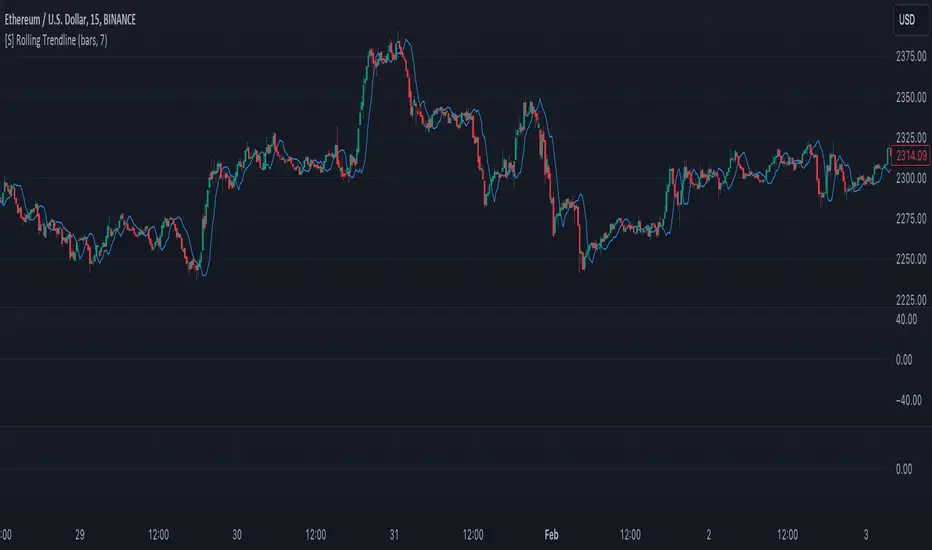
The Rolling Linear Regression Trendline is a sophisticated technical analysis tool designed to offer traders a dynamic view of market trends over a selectable period. This indicator employs linear regression to calculate and plot a trendline that best fits the closing prices within a specified window, either defined by a number of bars or a set period in days, independent of the chart's timeframe.
Key Features:
Dynamic Window Selection: Users can choose the calculation window based on a fixed number of bars or days, providing flexibility to adapt to different trading strategies and timeframes. For the 'days' option, the indicator calculates the equivalent number of bars based on the chart's timeframe, ensuring relevance across various market conditions and trading sessions.
Linear Regression Analysis: At its core, the indicator uses linear regression to identify the trend direction by calculating the slope and intercept of the trendline. This method offers a statistical approach to trend analysis, highlighting potential uptrends or downtrends based on the positioning and direction of the trendline.
Customizable Period: Traders can input their desired period (N), allowing for tailored analysis. Whether it's short-term movements or longer-term trends, the indicator can adjust to focus on specific time horizons, enhancing its utility across different trading styles and objectives.
Applications:
Trend Identification: By plotting a trendline that mathematically fits the closing prices over the chosen period, traders can quickly identify the prevailing market trend, aiding in bullish or bearish decision-making.
Support and Resistance: The trendline can also serve as a dynamic level of support or resistance, offering potential entry or exit points based on the price's interaction with the trendline.
Strategic Planning: With the ability to adjust the calculation window, traders can align the indicator with their trading strategy, whether focusing on intraday movements or broader swings.
Using this indicator with other parameters can widen you view of the market and help identifying trends
오픈 소스 스크립트
트레이딩뷰의 진정한 정신에 따라, 이 스크립트의 작성자는 이를 오픈소스로 공개하여 트레이더들이 기능을 검토하고 검증할 수 있도록 했습니다. 작성자에게 찬사를 보냅니다! 이 코드는 무료로 사용할 수 있지만, 코드를 재게시하는 경우 하우스 룰이 적용된다는 점을 기억하세요.
면책사항
해당 정보와 게시물은 금융, 투자, 트레이딩 또는 기타 유형의 조언이나 권장 사항으로 간주되지 않으며, 트레이딩뷰에서 제공하거나 보증하는 것이 아닙니다. 자세한 내용은 이용 약관을 참조하세요.
오픈 소스 스크립트
트레이딩뷰의 진정한 정신에 따라, 이 스크립트의 작성자는 이를 오픈소스로 공개하여 트레이더들이 기능을 검토하고 검증할 수 있도록 했습니다. 작성자에게 찬사를 보냅니다! 이 코드는 무료로 사용할 수 있지만, 코드를 재게시하는 경우 하우스 룰이 적용된다는 점을 기억하세요.
면책사항
해당 정보와 게시물은 금융, 투자, 트레이딩 또는 기타 유형의 조언이나 권장 사항으로 간주되지 않으며, 트레이딩뷰에서 제공하거나 보증하는 것이 아닙니다. 자세한 내용은 이용 약관을 참조하세요.