OPEN-SOURCE SCRIPT
업데이트됨 Candle Percentage Change
ndicator Setup: The script creates an indicator that overlays on the price chart.
Percentage Calculation: It calculates the percentage change between the current and previous candle closes.
Percentage Calculation: It calculates the percentage change between the current and previous candle closes.
릴리즈 노트
Key Features:Percentage Change Calculation:
The script calculates the percentage change between the closing price of the current candle and the previous candle.
The text color of the percentage change is determined based on the direction of the candle:
Green for bullish candles (close > open).
Red for bearish candles (close < open).
Label Positioning:
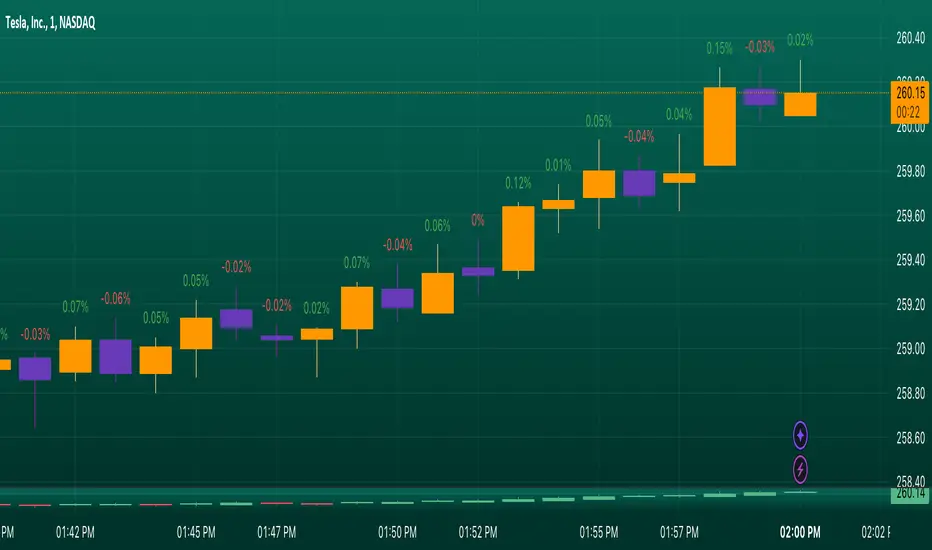
The percentage change label is positioned slightly above the high of each candle to ensure visibility and avoid overlap with the candle body.
The label uses the syminfo.mintick variable to maintain appropriate spacing based on the instrument's tick size.
Label Creation:
A new label is created for each candle, displaying the calculated percentage change as text.
The label has a transparent background for a cleaner appearance on the chart.
Usage:
This indicator can be added to any price chart in TradingView. It allows traders to assess price movements quickly, identify trends, and make informed trading decisions based on recent price changes.
Example of Use:
A trader looking at a candlestick chart can easily spot how much the price has changed between each candle. For instance, a label showing "+2.35%" indicates a 2.35% increase from the previous close, while "-1.20%" indicates a 1.20% decrease.
This script is particularly useful for day traders, swing traders, and anyone interested in analyzing price action with a clear visual representation of percentage changes in the market.
릴리즈 노트
Indicator Setup: The script creates an indicator that overlays on the price chart.Percentage Calculation: It calculates the percentage change between the current and previous candle closes.
Key Features:
Percentage Change Calculation:
The script calculates the percentage change between the closing price of the current candle and the previous candle.
The text color of the percentage change is determined based on the direction of the candle:
Green for bullish candles (close > open).
Red for bearish candles (close < open).
Usage:
This indicator can be added to any price chart in TradingView. It allows traders to assess price movements quickly, identify trends, and make informed trading decisions based on recent price changes.
Example of Use:
A trader looking at a candlestick chart can easily spot how much the price has changed between each candle. For instance, a label showing "+2.35%" indicates a 2.35% increase from the previous close, while "-1.20%" indicates a 1.20% decrease.
This script is particularly useful for day traders, swing traders, and anyone interested in analyzing price action with a clear visual representation of percentage changes in the market.
릴리즈 노트
Label overlapping issues fixed.릴리즈 노트
Label position fixed오픈 소스 스크립트
트레이딩뷰의 진정한 정신에 따라, 이 스크립트의 작성자는 이를 오픈소스로 공개하여 트레이더들이 기능을 검토하고 검증할 수 있도록 했습니다. 작성자에게 찬사를 보냅니다! 이 코드는 무료로 사용할 수 있지만, 코드를 재게시하는 경우 하우스 룰이 적용된다는 점을 기억하세요.
면책사항
해당 정보와 게시물은 금융, 투자, 트레이딩 또는 기타 유형의 조언이나 권장 사항으로 간주되지 않으며, 트레이딩뷰에서 제공하거나 보증하는 것이 아닙니다. 자세한 내용은 이용 약관을 참조하세요.
오픈 소스 스크립트
트레이딩뷰의 진정한 정신에 따라, 이 스크립트의 작성자는 이를 오픈소스로 공개하여 트레이더들이 기능을 검토하고 검증할 수 있도록 했습니다. 작성자에게 찬사를 보냅니다! 이 코드는 무료로 사용할 수 있지만, 코드를 재게시하는 경우 하우스 룰이 적용된다는 점을 기억하세요.
면책사항
해당 정보와 게시물은 금융, 투자, 트레이딩 또는 기타 유형의 조언이나 권장 사항으로 간주되지 않으며, 트레이딩뷰에서 제공하거나 보증하는 것이 아닙니다. 자세한 내용은 이용 약관을 참조하세요.