OPEN-SOURCE SCRIPT
Previous Daily OHLC
Previous Daily OHLC Indicator
Overview:
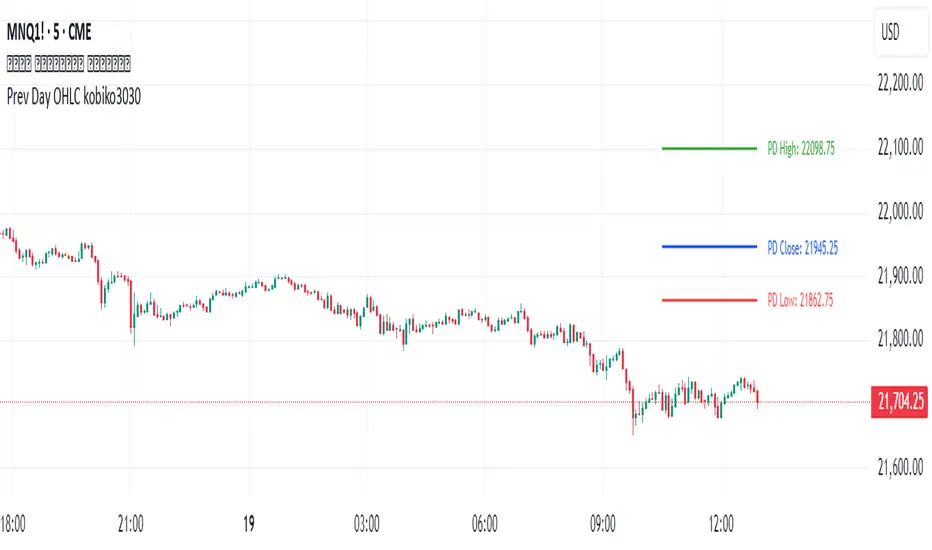
This professional TradingView indicator displays the previous day's key price levels (Open, High, Low, Close, and 50% midpoint) as horizontal lines on your chart. These levels are essential for traders who use previous day data as support and resistance zones in their technical analysis.
What It Does
Displays Previous Day Levels: Automatically shows horizontal lines for yesterday's OHLC data
Real-Time Updates: Lines update dynamically each new trading day
Fully Customizable: Complete control over which levels to display and how they appear
Smart Line Management: Choose between showing lines for recent bars or across the entire chart
Professional Labels: Clear labels with optional price values for each level
Color Coded System: Distinct colors for each level type for instant recognition
Key Features
Five Important Price Levels
Previous Day Open: Yesterday's opening price - often acts as psychological level
Previous Day High: Yesterday's highest price - key resistance level for breakout trading
Previous Day Low: Yesterday's lowest price - important support level for breakdowns
Previous Day Close: Yesterday's closing price - significant reference point
50% Midpoint: Calculated midpoint between previous day's high and low - bias indicator
Overview:
This professional TradingView indicator displays the previous day's key price levels (Open, High, Low, Close, and 50% midpoint) as horizontal lines on your chart. These levels are essential for traders who use previous day data as support and resistance zones in their technical analysis.
What It Does
Displays Previous Day Levels: Automatically shows horizontal lines for yesterday's OHLC data
Real-Time Updates: Lines update dynamically each new trading day
Fully Customizable: Complete control over which levels to display and how they appear
Smart Line Management: Choose between showing lines for recent bars or across the entire chart
Professional Labels: Clear labels with optional price values for each level
Color Coded System: Distinct colors for each level type for instant recognition
Key Features
Five Important Price Levels
Previous Day Open: Yesterday's opening price - often acts as psychological level
Previous Day High: Yesterday's highest price - key resistance level for breakout trading
Previous Day Low: Yesterday's lowest price - important support level for breakdowns
Previous Day Close: Yesterday's closing price - significant reference point
50% Midpoint: Calculated midpoint between previous day's high and low - bias indicator
오픈 소스 스크립트
트레이딩뷰의 진정한 정신에 따라, 이 스크립트의 작성자는 이를 오픈소스로 공개하여 트레이더들이 기능을 검토하고 검증할 수 있도록 했습니다. 작성자에게 찬사를 보냅니다! 이 코드는 무료로 사용할 수 있지만, 코드를 재게시하는 경우 하우스 룰이 적용된다는 점을 기억하세요.
면책사항
해당 정보와 게시물은 금융, 투자, 트레이딩 또는 기타 유형의 조언이나 권장 사항으로 간주되지 않으며, 트레이딩뷰에서 제공하거나 보증하는 것이 아닙니다. 자세한 내용은 이용 약관을 참조하세요.
오픈 소스 스크립트
트레이딩뷰의 진정한 정신에 따라, 이 스크립트의 작성자는 이를 오픈소스로 공개하여 트레이더들이 기능을 검토하고 검증할 수 있도록 했습니다. 작성자에게 찬사를 보냅니다! 이 코드는 무료로 사용할 수 있지만, 코드를 재게시하는 경우 하우스 룰이 적용된다는 점을 기억하세요.
면책사항
해당 정보와 게시물은 금융, 투자, 트레이딩 또는 기타 유형의 조언이나 권장 사항으로 간주되지 않으며, 트레이딩뷰에서 제공하거나 보증하는 것이 아닙니다. 자세한 내용은 이용 약관을 참조하세요.