OPEN-SOURCE SCRIPT
Mr. Laz's Fibonacci MA
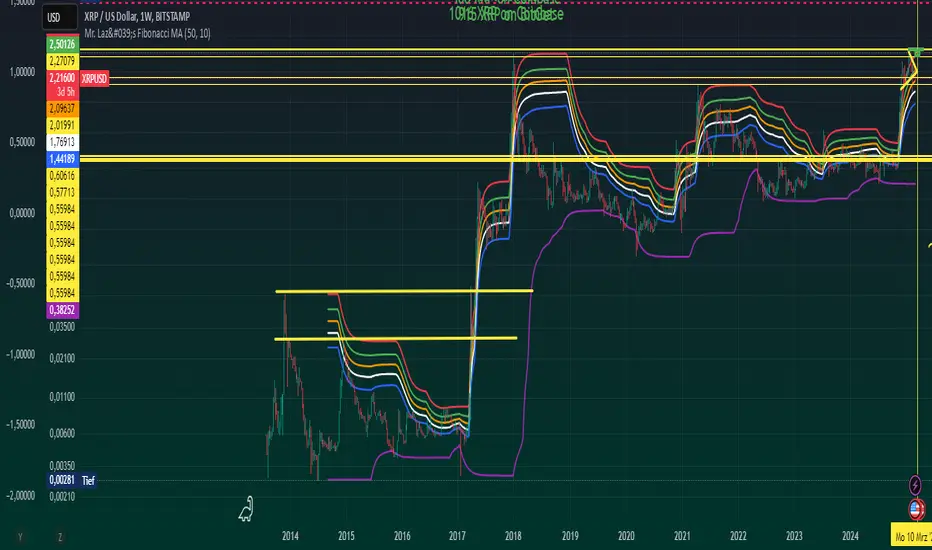
Smoothed Fibonacci Moving Average
This indicator plots six Fibonacci retracement levels overlaid on the chart, with each level smoothly adjusted using an Exponential Moving Average (EMA). The Fibonacci levels are calculated based on the highest high and lowest low over a user-defined period, and they represent key support and resistance zones that traders often watch for price reversals.
The six Fibonacci retracement levels plotted are:
0% (Fib 0): Top level (representing the highest point in the range).
23.6% (Fib 23.6%)
38.2% (Fib 38.2%)
50% (Fib 50%)
61.8% (Fib 61.8%)
100% (Fib 100): Bottom level (representing the lowest point in the range).
These levels are smoothed using a user-defined Smoothing Length, which helps reduce the "zig-zag" nature of the lines and provides a more gradual, smoother appearance as they follow the price movement. The indicator allows you to adjust the smoothing factor to control how sensitive the lines are to price changes.
The colors of the Fibonacci levels are customizable and are plotted from top to bottom as:
Red (for Fib 100%)
Green (for Fib 23.6%)
Orange (for Fib 38.2%)
White (for Fib 50%)
Blue (for Fib 61.8%)
Purple (for Fib 0%)
This indicator is useful for identifying key support and resistance zones based on Fibonacci retracement levels, with the added benefit of smoothing to make the lines more visually appealing and less prone to sudden shifts.
오픈 소스 스크립트
트레이딩뷰의 진정한 정신에 따라, 이 스크립트의 작성자는 이를 오픈소스로 공개하여 트레이더들이 기능을 검토하고 검증할 수 있도록 했습니다. 작성자에게 찬사를 보냅니다! 이 코드는 무료로 사용할 수 있지만, 코드를 재게시하는 경우 하우스 룰이 적용된다는 점을 기억하세요.
면책사항
해당 정보와 게시물은 금융, 투자, 트레이딩 또는 기타 유형의 조언이나 권장 사항으로 간주되지 않으며, 트레이딩뷰에서 제공하거나 보증하는 것이 아닙니다. 자세한 내용은 이용 약관을 참조하세요.
오픈 소스 스크립트
트레이딩뷰의 진정한 정신에 따라, 이 스크립트의 작성자는 이를 오픈소스로 공개하여 트레이더들이 기능을 검토하고 검증할 수 있도록 했습니다. 작성자에게 찬사를 보냅니다! 이 코드는 무료로 사용할 수 있지만, 코드를 재게시하는 경우 하우스 룰이 적용된다는 점을 기억하세요.
면책사항
해당 정보와 게시물은 금융, 투자, 트레이딩 또는 기타 유형의 조언이나 권장 사항으로 간주되지 않으며, 트레이딩뷰에서 제공하거나 보증하는 것이 아닙니다. 자세한 내용은 이용 약관을 참조하세요.