OPEN-SOURCE SCRIPT
UpVol/TVol NYSE Lowry Upside Days
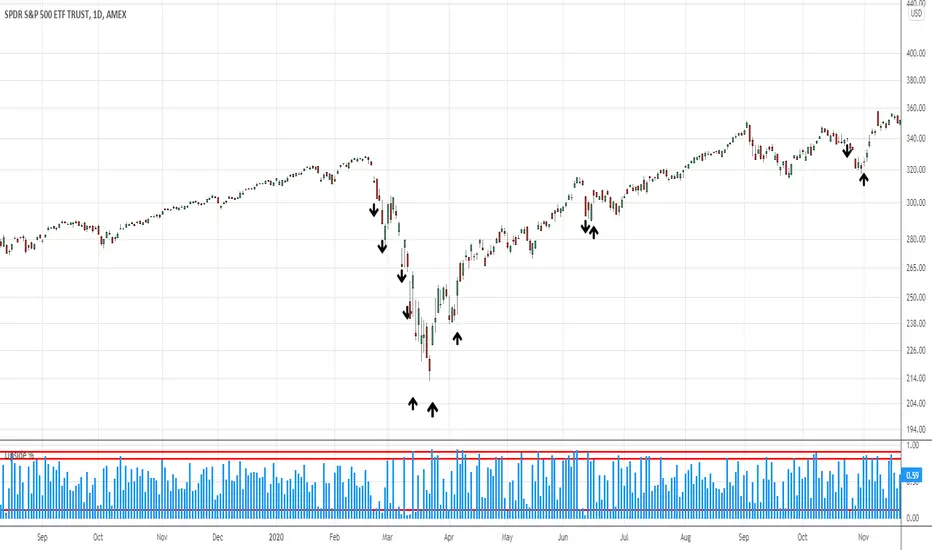
Takes Tradingviews Upside Volume for NYSE and divides it by Total Volume on NYSE.
Tradingview's data source generally has different volume figures than say the Wall Street Journal. Therefore, this indicator is an estimate.
10% upside volume shows extreme panic and is consistent with market sell offs.
90% upside days, following a decline, are often occur within a week or so of significant market bottoms.
Recommend using columns as the plot type.
Based on research of LowryResearch Corp.
오픈 소스 스크립트
트레이딩뷰의 진정한 정신에 따라, 이 스크립트의 작성자는 이를 오픈소스로 공개하여 트레이더들이 기능을 검토하고 검증할 수 있도록 했습니다. 작성자에게 찬사를 보냅니다! 이 코드는 무료로 사용할 수 있지만, 코드를 재게시하는 경우 하우스 룰이 적용된다는 점을 기억하세요.
Cory Mitchell, CMT
Stock and forex trading insights at tradethatswing.com/
Stock and forex trading insights at tradethatswing.com/
면책사항
해당 정보와 게시물은 금융, 투자, 트레이딩 또는 기타 유형의 조언이나 권장 사항으로 간주되지 않으며, 트레이딩뷰에서 제공하거나 보증하는 것이 아닙니다. 자세한 내용은 이용 약관을 참조하세요.