OPEN-SOURCE SCRIPT
Automatic Fibonacci Levels with EMA

Automatic Fibonacci Levels with EMA
Description:
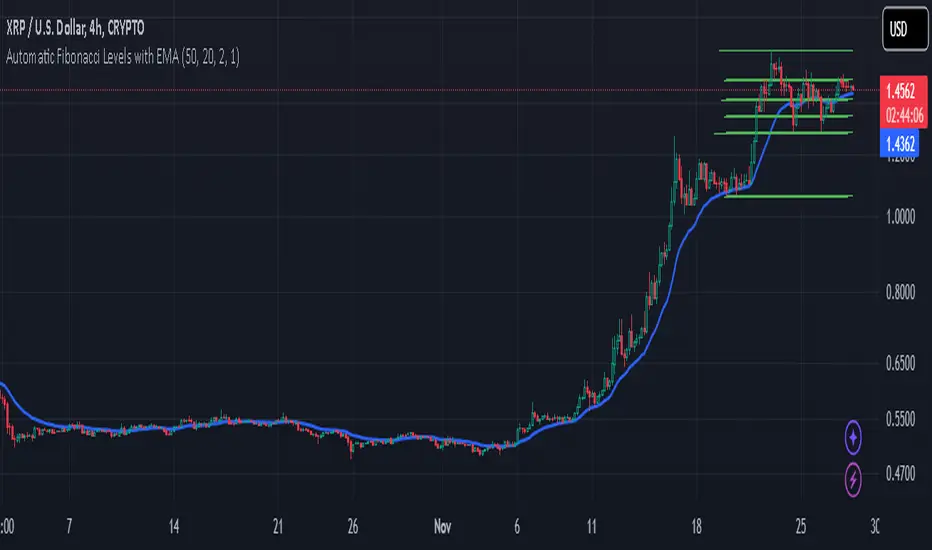
This script automatically calculates and displays Fibonacci retracement levels based on the highest and lowest prices over a dynamic lookback period. The Fibonacci levels are recalculated on every bar to adapt to price changes, providing an ongoing analysis of key support and resistance areas.
The Fibonacci levels are dynamically colored to reflect the trend direction, determined by the position of the price relative to the Exponential Moving Average (EMA). When the market is in an uptrend (price above EMA), Fibonacci levels are displayed in green, and in a downtrend (price below EMA), they are shown in red. This color coding helps traders quickly identify the current market direction.
Key Features:
Dynamic Fibonacci Levels: Automatically adjusts Fibonacci retracement levels based on recent price action, recalculated with each new bar.
EMA Trend Confirmation: The trend is confirmed by the position of the price relative to the 20-period EMA. Fibonacci levels are color-coded to reflect this trend.
Customizable Lookback Period: Adjust the base lookback period (default 50) and scale it according to your preferred timeframe for more or less sensitivity to recent price action.
Flexible Fibonacci Duration: The Fibonacci levels remain on the chart for a customizable duration (default 2 bars), allowing for visual clarity while adapting to new price action.
Timeframe Scaling: The script automatically adjusts the lookback period based on a scaling factor, making it suitable for different timeframes.
How to Use:
Use the Fibonacci levels to identify potential support and resistance zones based on the market's current price range.
Combine the trend color coding with your own strategy to enhance decision-making, whether for long or short entries.
Adjust the Lookback Period and Fibonacci Duration based on your trading style and timeframe preferences.
This script provides an automatic and customizable way to visualize Fibonacci retracements in a dynamic manner, helping traders make informed decisions based on trend direction and key price levels.
Note: As with any trading tool, always use proper risk management and test the script before using it in live trading.
오픈 소스 스크립트
트레이딩뷰의 진정한 정신에 따라, 이 스크립트의 작성자는 이를 오픈소스로 공개하여 트레이더들이 기능을 검토하고 검증할 수 있도록 했습니다. 작성자에게 찬사를 보냅니다! 이 코드는 무료로 사용할 수 있지만, 코드를 재게시하는 경우 하우스 룰이 적용된다는 점을 기억하세요.
면책사항
해당 정보와 게시물은 금융, 투자, 트레이딩 또는 기타 유형의 조언이나 권장 사항으로 간주되지 않으며, 트레이딩뷰에서 제공하거나 보증하는 것이 아닙니다. 자세한 내용은 이용 약관을 참조하세요.
오픈 소스 스크립트
트레이딩뷰의 진정한 정신에 따라, 이 스크립트의 작성자는 이를 오픈소스로 공개하여 트레이더들이 기능을 검토하고 검증할 수 있도록 했습니다. 작성자에게 찬사를 보냅니다! 이 코드는 무료로 사용할 수 있지만, 코드를 재게시하는 경우 하우스 룰이 적용된다는 점을 기억하세요.
면책사항
해당 정보와 게시물은 금융, 투자, 트레이딩 또는 기타 유형의 조언이나 권장 사항으로 간주되지 않으며, 트레이딩뷰에서 제공하거나 보증하는 것이 아닙니다. 자세한 내용은 이용 약관을 참조하세요.