OPEN-SOURCE SCRIPT
M2 Money Shift for Bitcoin [SAKANE]
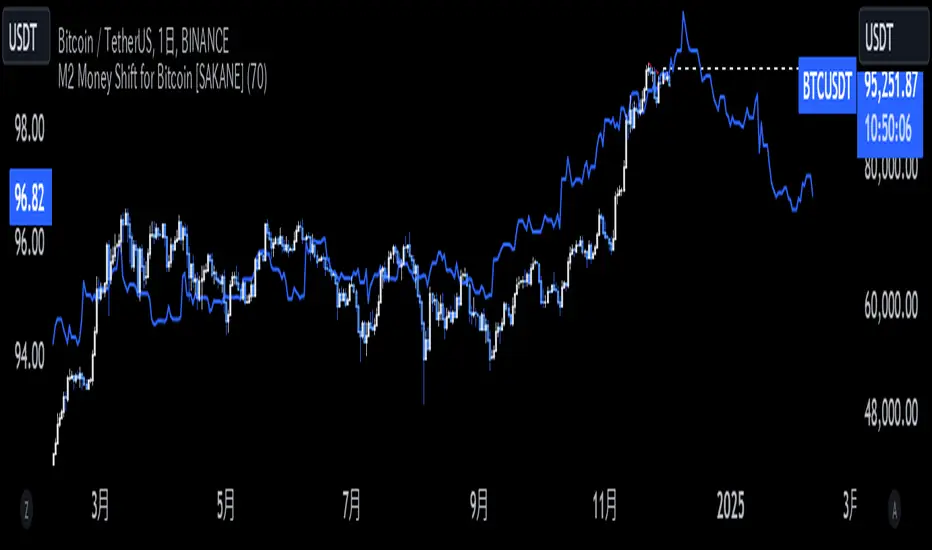
M2 Money Shift for Bitcoin was developed to visualize the impact of M2 Money, a macroeconomic indicator, on the Bitcoin market and to support trade analysis.
Bitcoin price fluctuations have a certain correlation with cycles in M2 money supply.In particular, it has been noted that changes in M2 supply can affect the bitcoin price 70 days in advance.Very high correlations have been observed in recent years in particular, making it useful as a supplemental analytical tool for trading.
Support for M2 data from multiple countries
M2 supply data from the U.S., Europe, China, Japan, the U.K., Canada, Australia, and India are integrated and all are displayed in U.S. dollar equivalents.
Slide function
Using the "Slide Days Forward" setting, M2 data can be slid up to 500 days, allowing for flexible analysis that takes into account the time difference from the bitcoin price.
Plotting Total Liquidity
Plot total liquidity (in trillions of dollars) by summing the M2 supply of multiple countries.
How to use
After applying the indicator to the chart, activate the M2 data for the required country from the settings screen. 2.
2. adjust "Slide Days Forward" to analyze the relationship between changes in M2 supply and bitcoin price
3. refer to the Gross Liquidity plot to build a trading strategy that takes into account macroeconomic influences.
Notes.
This indicator is an auxiliary tool for trade analysis and does not guarantee future price trends.
The relationship between M2 supply and bitcoin price depends on many factors and should be used in conjunction with other analysis methods.
오픈 소스 스크립트
트레이딩뷰의 진정한 정신에 따라, 이 스크립트의 작성자는 이를 오픈소스로 공개하여 트레이더들이 기능을 검토하고 검증할 수 있도록 했습니다. 작성자에게 찬사를 보냅니다! 이 코드는 무료로 사용할 수 있지만, 코드를 재게시하는 경우 하우스 룰이 적용된다는 점을 기억하세요.
면책사항
해당 정보와 게시물은 금융, 투자, 트레이딩 또는 기타 유형의 조언이나 권장 사항으로 간주되지 않으며, 트레이딩뷰에서 제공하거나 보증하는 것이 아닙니다. 자세한 내용은 이용 약관을 참조하세요.
오픈 소스 스크립트
트레이딩뷰의 진정한 정신에 따라, 이 스크립트의 작성자는 이를 오픈소스로 공개하여 트레이더들이 기능을 검토하고 검증할 수 있도록 했습니다. 작성자에게 찬사를 보냅니다! 이 코드는 무료로 사용할 수 있지만, 코드를 재게시하는 경우 하우스 룰이 적용된다는 점을 기억하세요.
면책사항
해당 정보와 게시물은 금융, 투자, 트레이딩 또는 기타 유형의 조언이나 권장 사항으로 간주되지 않으며, 트레이딩뷰에서 제공하거나 보증하는 것이 아닙니다. 자세한 내용은 이용 약관을 참조하세요.