OPEN-SOURCE SCRIPT
Double Bottom and Top Hunter
### Türkçe Açıklama:
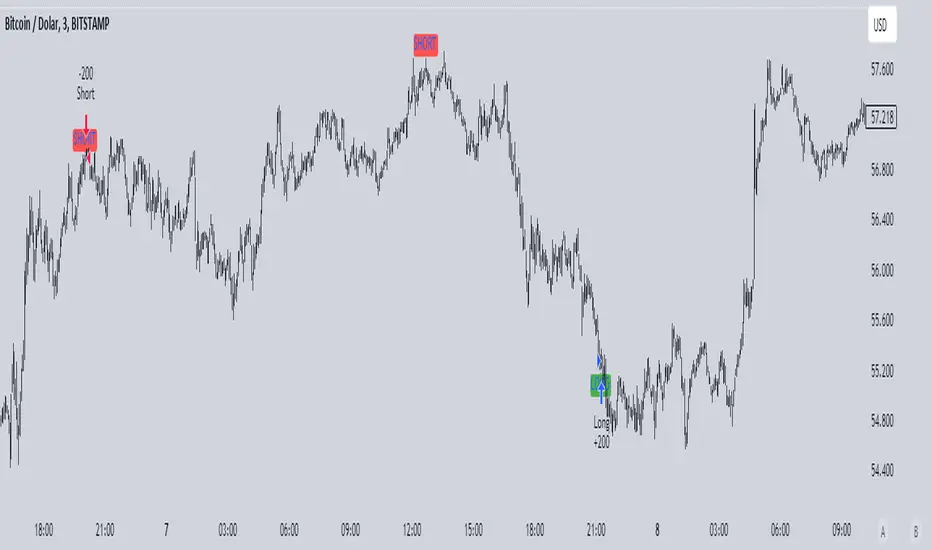
Bu strateji, grafikte ikili dip ve ikili tepe formasyonlarını tespit ederek otomatik alım ve satım işlemleri gerçekleştirir. İkili dip, fiyatın belirli bir dönem içinde iki kez en düşük seviyeye ulaşması ile oluşur ve bu durumda strateji long (alım) işlemi açar. İkili tepe ise fiyatın belirli bir dönem içinde iki kez en yüksek seviyeye ulaşması ile oluşur ve bu durumda strateji short (satış) işlemi açar.
- **Dönem Uzunluğu ve Geriye Dönük Kontrol:** Strateji, varsayılan olarak 100 periyotluk bir zaman dilimini temel alır ve bu süre boyunca en düşük ve en yüksek fiyat seviyelerini belirler. Geriye dönük kontrol süresi de 100 periyot olarak ayarlanmıştır.
- **İşlem Açma Koşulları:** İkili dip tespit edildiğinde long pozisyon, ikili tepe tespit edildiğinde short pozisyon açılır.
- **İşlem Kapatma Koşulları:** İkili dipte, en yüksek seviyeye (HH) ulaşıldıktan sonra fiyatın daha düşük bir seviye (LL) yapması durumunda pozisyon kapanır. İkili tepede ise tam tersi bir durumda, pozisyon kapanır.
- **Zigzag Çizimi:** İkili dip ve tepe formasyonları, grafik üzerinde yeşil (dipler) ve kırmızı (tepeler) zigzag çizgileri ile gösterilir.
Bu strateji, özellikle 1, 3 ve 5 dakikalık kısa zaman dilimlerinde yüksek başarı oranına sahiptir ve piyasadaki kısa vadeli trend dönüşlerini yakalamada etkili bir araçtır.
### English Explanation:
This strategy automatically executes buy and sell orders by detecting double bottom and double top formations on the chart. A double bottom occurs when the price reaches a low level twice within a specific period, prompting the strategy to open a long (buy) position. Conversely, a double top forms when the price reaches a high level twice, leading the strategy to open a short (sell) position.
- **Period Length and Lookback Control:** By default, the strategy is based on a 100-period length, during which it identifies the lowest and highest price levels. The lookback control period is also set to 100 periods.
- **Entry Conditions:** A long position is opened when a double bottom is detected, while a short position is opened when a double top is identified.
- **Exit Conditions:** In the case of a double bottom, the position is closed after the price reaches a higher high (HH) and then makes a lower low (LL). For a double top, the opposite occurs before closing the position.
- **Zigzag Plotting:** The double bottom and top formations are visually represented on the chart with green (bottoms) and red (tops) zigzag lines.
This strategy is particularly successful in short timeframes such as 1, 3, and 5 minutes and is an effective tool for capturing short-term trend reversals in the market.
오픈 소스 스크립트
트레이딩뷰의 진정한 정신에 따라, 이 스크립트의 작성자는 이를 오픈소스로 공개하여 트레이더들이 기능을 검토하고 검증할 수 있도록 했습니다. 작성자에게 찬사를 보냅니다! 이 코드는 무료로 사용할 수 있지만, 코드를 재게시하는 경우 하우스 룰이 적용된다는 점을 기억하세요.
면책사항
해당 정보와 게시물은 금융, 투자, 트레이딩 또는 기타 유형의 조언이나 권장 사항으로 간주되지 않으며, 트레이딩뷰에서 제공하거나 보증하는 것이 아닙니다. 자세한 내용은 이용 약관을 참조하세요.
오픈 소스 스크립트
트레이딩뷰의 진정한 정신에 따라, 이 스크립트의 작성자는 이를 오픈소스로 공개하여 트레이더들이 기능을 검토하고 검증할 수 있도록 했습니다. 작성자에게 찬사를 보냅니다! 이 코드는 무료로 사용할 수 있지만, 코드를 재게시하는 경우 하우스 룰이 적용된다는 점을 기억하세요.
면책사항
해당 정보와 게시물은 금융, 투자, 트레이딩 또는 기타 유형의 조언이나 권장 사항으로 간주되지 않으며, 트레이딩뷰에서 제공하거나 보증하는 것이 아닙니다. 자세한 내용은 이용 약관을 참조하세요.