OPEN-SOURCE SCRIPT
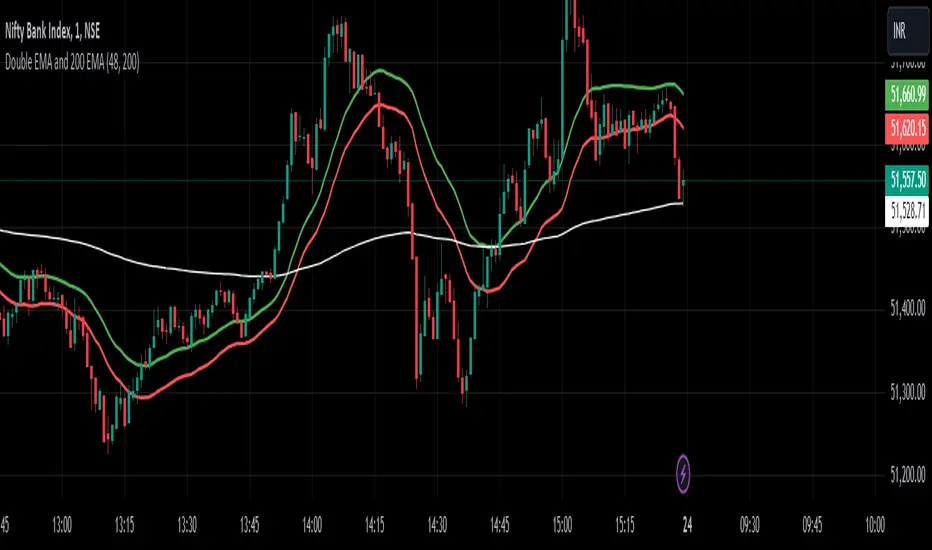
Jikdi Double EMA and 200 EMA

Double EMA and 200 EMA Indicator
Overview:
The Double EMA and 200 EMA indicator combines two exponential moving averages (EMA) to provide insights into short-term and longer-term trends in a financial instrument's price movements.
Components:
Double EMA:
Calculation: The Double EMA is derived by applying the EMA formula twice to a given price series. First, an EMA is calculated based on a specified length (parameter). Then, a second EMA is computed on the first EMA result, resulting in a smoother moving average that reacts more quickly to recent price changes compared to a single EMA.
Purpose: The Double EMA helps traders identify short-term trends by smoothing out price fluctuations, making it easier to spot potential entry and exit points based on momentum shifts.
200 EMA:
Calculation: The 200 EMA is calculated by applying the EMA formula to the closing prices of the financial instrument over a longer period, typically 200 periods.
Purpose: The 200 EMA is widely used by traders and analysts to assess the long-term trend direction of an asset. It acts as a key support or resistance level and is considered significant in determining the overall market sentiment and potential reversals.
Usage:
Short-term Trading: Traders use the Double EMA to identify short-term trends and trade opportunities. When the Double EMA crosses above the price, it may signal a bullish trend, while a cross below the price could indicate a bearish trend.
Long-term Analysis: The 200 EMA serves as a reference for long-term trend analysis. Prices trading above the 200 EMA suggest a bullish bias, while trading below it indicates a bearish sentiment.
Interpretation:
Crossovers: Crosses between the Double EMA and the 200 EMA or crosses of the Double EMA with the price can be potential signals for entry or exit positions, depending on the trading strategy employed.
Trend Confirmation: Traders often look for confluence between short-term (Double EMA) and long-term (200 EMA) trends to confirm the strength of a trend or to identify potential reversals.
Conclusion:
The Double EMA and 200 EMA indicator provides a comprehensive view of both short-term momentum and longer-term trend direction. By combining these moving averages, traders can make informed decisions based on the dynamics of price movements and trend confirmations.
오픈 소스 스크립트
트레이딩뷰의 진정한 정신에 따라, 이 스크립트의 작성자는 이를 오픈소스로 공개하여 트레이더들이 기능을 검토하고 검증할 수 있도록 했습니다. 작성자에게 찬사를 보냅니다! 이 코드는 무료로 사용할 수 있지만, 코드를 재게시하는 경우 하우스 룰이 적용된다는 점을 기억하세요.
면책사항
해당 정보와 게시물은 금융, 투자, 트레이딩 또는 기타 유형의 조언이나 권장 사항으로 간주되지 않으며, 트레이딩뷰에서 제공하거나 보증하는 것이 아닙니다. 자세한 내용은 이용 약관을 참조하세요.
오픈 소스 스크립트
트레이딩뷰의 진정한 정신에 따라, 이 스크립트의 작성자는 이를 오픈소스로 공개하여 트레이더들이 기능을 검토하고 검증할 수 있도록 했습니다. 작성자에게 찬사를 보냅니다! 이 코드는 무료로 사용할 수 있지만, 코드를 재게시하는 경우 하우스 룰이 적용된다는 점을 기억하세요.
면책사항
해당 정보와 게시물은 금융, 투자, 트레이딩 또는 기타 유형의 조언이나 권장 사항으로 간주되지 않으며, 트레이딩뷰에서 제공하거나 보증하는 것이 아닙니다. 자세한 내용은 이용 약관을 참조하세요.