INVITE-ONLY SCRIPT
업데이트됨 Cash The System Trend Indicator (STRATEGY)
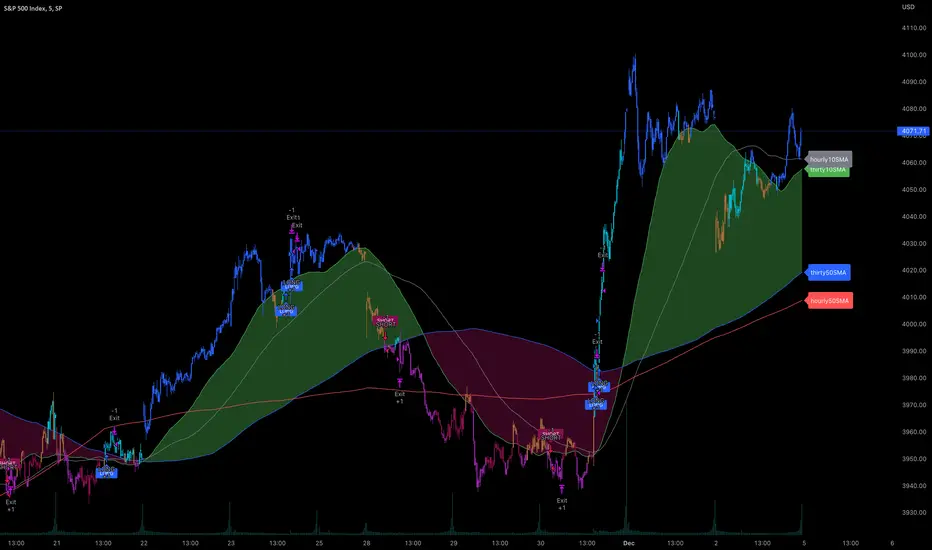
The System, created by @MasterBJones looks at the higher timeframe trend of SPX to determine Buy and Sell Signals.
If the 10SMA on the 30min chart is trading over the 50sma, then the market is bullish . If the 10SMA is trading under the 50SMA on the 30min chart, then the market is bearish .
This Indicator colors the candles based on what The System is currently telling us.
Blue = Strong Bullish - SPX/Ticker is trading above the 10 SMA and the 10 SMA > 50 SMA giving a BUY signal.
Aqua = Mild Bullish - SPX/Ticker is trading above the 50 SMA , but we do not have a BUY signal yet. MACD is bullish.
Amber = Uncertainty in the market. SPX/Ticker is in a chop zone, and trades in this area are high risk.
Pink = Mild Bearish - SPX/Ticker is trading below the 50 SMA , but we do not have a SELL signal yet. MACD is bearish.
Purple = Strong Bearish - SPX/Ticker is trading below the 10 SMA , and the 10 SMA < 50 SMA giving a SELL signal.
Along with the colored candlesticks , the indicator will signal when to go LONG or SHORT based on when the trend direction changes.
While The System was designed to be based on SPX , you can use this indicator to trade $ES_F futures , SPY options, SPX options, and other indexes.
Some users are also using the 10/50SMA to trade other tickers such as TSLA based on the same set of rules.
The official documentation for The System is based on SPX so be careful deviating from that ruleset and be sure to backtest before jumping in to trades with this.
Note - this indicator is experimental and your mileage may vary.
Please learn the system by following @MasterBJones on Twitter
릴리즈 노트
Updated the Chart Preview릴리즈 노트
tidied up some of the alert signal code to make it easier to manage. No change in the actual alert with this tweak.릴리즈 노트
Added the bands for the 100pt extended area on SPX릴리즈 노트
Added the ability to dynamically control the Profit/StopLoss logic when backtesting the strategy.릴리즈 노트
Fixed an issue where the bar colors for mild bullish and mild bearish were not quite right when price was moving back towards the 10sma (eg sell signal and trading under the 10/50sma but macd turning bullish)릴리즈 노트
- Added setting to enable/disable entry alerts
- Added setting to show OverBought/OverSold bands. Options are None, Bollinger Bands (2sd line), Bollinger Band Bands (shading for the BB Band between 1sd and 2sd lines), or the 100pt Extended line for SPX.
- Added tooltips to labels
- Added Bollinger Bands for OverBought/OverSold levels, similar to how the 100pt extended lines work for SPX in TheSystem. Learn more about BB here: getthatcashmoney.com/blog/how-to-trade-with-bollinger-bands/
릴리즈 노트
Tweaked the logic that was setting the mild bullish (light blue color) on the candles incorrectly.초대 전용 스크립트
이 스크립트는 작성자가 승인한 사용자만 접근할 수 있습니다. 사용하려면 요청 후 승인을 받아야 하며, 일반적으로 결제 후에 허가가 부여됩니다. 자세한 내용은 아래 작성자의 안내를 따르거나 getthatcashmoney에게 직접 문의하세요.
이 비공개 초대 전용 스크립트는 스크립트 모더레이터의 검토를 거치지 않았으며, 하우스 룰 준수 여부는 확인되지 않았습니다. 트레이딩뷰는 스크립트의 작동 방식을 충분히 이해하고 작성자를 완전히 신뢰하지 않는 이상, 해당 스크립트에 비용을 지불하거나 사용하는 것을 권장하지 않습니다. 커뮤니티 스크립트에서 무료 오픈소스 대안을 찾아보실 수도 있습니다.
작성자 지시 사항
Get Access at http://www.getthatcashmoney.com
면책사항
해당 정보와 게시물은 금융, 투자, 트레이딩 또는 기타 유형의 조언이나 권장 사항으로 간주되지 않으며, 트레이딩뷰에서 제공하거나 보증하는 것이 아닙니다. 자세한 내용은 이용 약관을 참조하세요.
초대 전용 스크립트
이 스크립트는 작성자가 승인한 사용자만 접근할 수 있습니다. 사용하려면 요청 후 승인을 받아야 하며, 일반적으로 결제 후에 허가가 부여됩니다. 자세한 내용은 아래 작성자의 안내를 따르거나 getthatcashmoney에게 직접 문의하세요.
이 비공개 초대 전용 스크립트는 스크립트 모더레이터의 검토를 거치지 않았으며, 하우스 룰 준수 여부는 확인되지 않았습니다. 트레이딩뷰는 스크립트의 작동 방식을 충분히 이해하고 작성자를 완전히 신뢰하지 않는 이상, 해당 스크립트에 비용을 지불하거나 사용하는 것을 권장하지 않습니다. 커뮤니티 스크립트에서 무료 오픈소스 대안을 찾아보실 수도 있습니다.
작성자 지시 사항
Get Access at http://www.getthatcashmoney.com
면책사항
해당 정보와 게시물은 금융, 투자, 트레이딩 또는 기타 유형의 조언이나 권장 사항으로 간주되지 않으며, 트레이딩뷰에서 제공하거나 보증하는 것이 아닙니다. 자세한 내용은 이용 약관을 참조하세요.