OPEN-SOURCE SCRIPT
Connors-Hayward Advance-Decline Trading Patterns
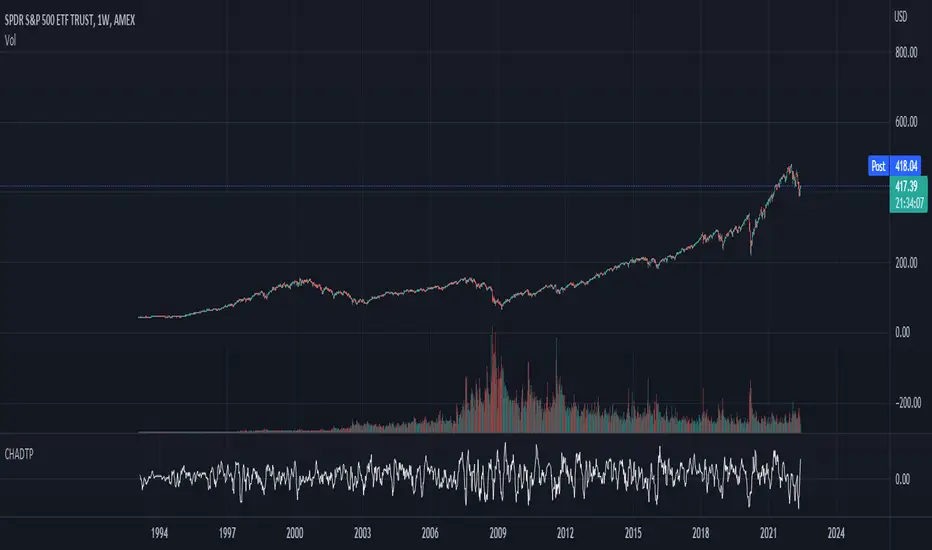
The following is an excerpt from Investment Secrets of a Hedge Fund Manager
"The Connors-Hayward Advance-Decline Trading Pattern (CHADTP) is a proprietary indicator we use to identify short- and intermediate-term overbought and oversold conditions for the stock market and the S&P 500 futures market...
Construction of the CHADTP indicator is simple:
Add the past five day's advancing issues from the New York Stock Exchange.
Add the past five day's declining issues from the NYSE.
Subtract #2 from #1.
Divide by five.
Here are the two rules to trade CHADTP:
When the five-day reading is above +400, the market is overbought; and when the five day reading is below -400, the market is oversold.
Unfortunately, just because the indicator is -400 does not mean we can blindly buy the market, and just because the indicator is +400 does not mean we should be a seller of the market.
Whenever we get an overbought or oversold reading, we wait for a specific price reversal before entering. When the CHADTP number is +400 or more, we will sell the market only after the S&P 500 futures trade .10 points below the previous day's low. For example, if we get a reading of +422 and today's low is 453.80 we will take a sell signal only if the market trades at 453.70 or below tomorrow. If tomorrow the market low is 454.60, and the CHADTP is above 400, we will only sell if the market trades at 454.50 or below the next day, and so on. On the buy side, if today's CHADTP number is -400 or less, we will buy only after tomorrow's S&P trades .10 points above today's high, and so on."
Note from Technicus Capital:
This method was created in 1995. Today, the volume and volatility of markets is much more significant and therefore the original overbought/oversold levels are no longer relevant.
오픈 소스 스크립트
트레이딩뷰의 진정한 정신에 따라, 이 스크립트의 작성자는 이를 오픈소스로 공개하여 트레이더들이 기능을 검토하고 검증할 수 있도록 했습니다. 작성자에게 찬사를 보냅니다! 이 코드는 무료로 사용할 수 있지만, 코드를 재게시하는 경우 하우스 룰이 적용된다는 점을 기억하세요.
면책사항
해당 정보와 게시물은 금융, 투자, 트레이딩 또는 기타 유형의 조언이나 권장 사항으로 간주되지 않으며, 트레이딩뷰에서 제공하거나 보증하는 것이 아닙니다. 자세한 내용은 이용 약관을 참조하세요.
오픈 소스 스크립트
트레이딩뷰의 진정한 정신에 따라, 이 스크립트의 작성자는 이를 오픈소스로 공개하여 트레이더들이 기능을 검토하고 검증할 수 있도록 했습니다. 작성자에게 찬사를 보냅니다! 이 코드는 무료로 사용할 수 있지만, 코드를 재게시하는 경우 하우스 룰이 적용된다는 점을 기억하세요.
면책사항
해당 정보와 게시물은 금융, 투자, 트레이딩 또는 기타 유형의 조언이나 권장 사항으로 간주되지 않으며, 트레이딩뷰에서 제공하거나 보증하는 것이 아닙니다. 자세한 내용은 이용 약관을 참조하세요.