PROTECTED SOURCE SCRIPT
BB vs KC Visual Zones
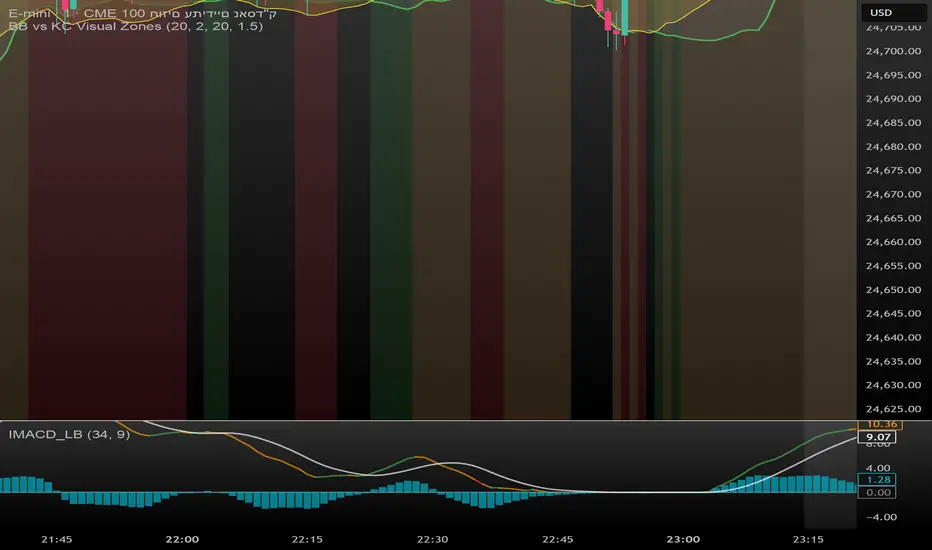
📌 BB vs KC Visual Zones
This script combines the power of two popular volatility indicators — Bollinger Bands (BB) and Keltner Channels (KC) — into one intuitive and visually enhanced tool. It is designed to help traders identify high-volatility moments in the market, often signaling potential breakouts.
✅ What’s Included:
Bollinger Bands based on SMA and standard deviation.
Keltner Channels based on EMA and ATR.
Color-coded highlights for quick visual analysis:
Upper BB in bold red when it crosses above the upper KC.
Lower BB in bold green when it drops below the lower KC.
Background color dynamically adjusts based on breakout conditions.
Clear visualization of Squeeze and Breakout scenarios directly on the main chart.
🎯 Best Used For:
Spotting potential breakout zones when BB expands beyond KC.
Understanding underlying market volatility conditions.
Using as a standalone volatility filter, or integrating into broader trading systems.
보호된 스크립트입니다
이 스크립트는 비공개 소스로 게시됩니다. 하지만 이를 자유롭게 제한 없이 사용할 수 있습니다 – 자세한 내용은 여기에서 확인하세요.
NinjADeviL
면책사항
해당 정보와 게시물은 금융, 투자, 트레이딩 또는 기타 유형의 조언이나 권장 사항으로 간주되지 않으며, 트레이딩뷰에서 제공하거나 보증하는 것이 아닙니다. 자세한 내용은 이용 약관을 참조하세요.
보호된 스크립트입니다
이 스크립트는 비공개 소스로 게시됩니다. 하지만 이를 자유롭게 제한 없이 사용할 수 있습니다 – 자세한 내용은 여기에서 확인하세요.
NinjADeviL
면책사항
해당 정보와 게시물은 금융, 투자, 트레이딩 또는 기타 유형의 조언이나 권장 사항으로 간주되지 않으며, 트레이딩뷰에서 제공하거나 보증하는 것이 아닙니다. 자세한 내용은 이용 약관을 참조하세요.