OPEN-SOURCE SCRIPT
업데이트됨 Smarter MACD
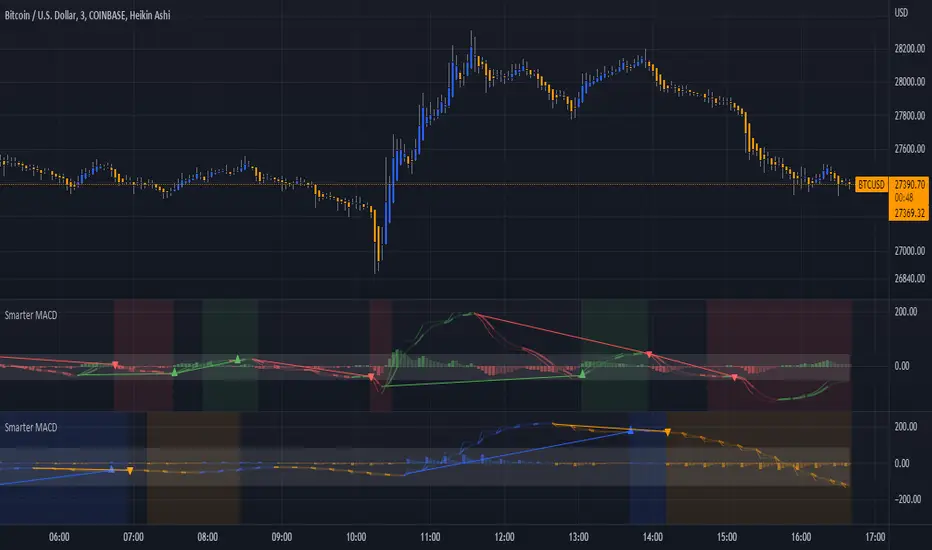
A classic MACD with average peak and dip lines. The lighter green and red horizontal lines are the average peak and dip of the entire span, respectively. The second, bolder of the two lines are the averages of the peaks and dips above and below the overall peak and dip averages. The filled in color is to help visualize these averages and possible trade setups. Rework of the MACD + Averages script.
릴리즈 노트
Clarified momentum divergence signals릴리즈 노트
Clarified momentum divergence markers릴리즈 노트
Added background coloring to better visualize clear bullish or bearish momentum릴리즈 노트
Added background coloring to better visualize clear bullish or bearish momentum, credits, updated indicator preview, and discord link.Don't forget to join the Discord group: discord.gg/fsbbhDZ3
릴리즈 노트
Added ATF (Adjustable Time Frame) for detecting confluence with higher timeframes, as well as color controls to differentiate between the two timeframes. By adding two to a chart, you can merge them to create overlaps by clicking on the ellipses on the indicator (...), clicking "Move To", and clicking the "Existing Pane Above" or "Existing Pane Below" options.오픈 소스 스크립트
트레이딩뷰의 진정한 정신에 따라, 이 스크립트의 작성자는 이를 오픈소스로 공개하여 트레이더들이 기능을 검토하고 검증할 수 있도록 했습니다. 작성자에게 찬사를 보냅니다! 이 코드는 무료로 사용할 수 있지만, 코드를 재게시하는 경우 하우스 룰이 적용된다는 점을 기억하세요.
면책사항
해당 정보와 게시물은 금융, 투자, 트레이딩 또는 기타 유형의 조언이나 권장 사항으로 간주되지 않으며, 트레이딩뷰에서 제공하거나 보증하는 것이 아닙니다. 자세한 내용은 이용 약관을 참조하세요.
오픈 소스 스크립트
트레이딩뷰의 진정한 정신에 따라, 이 스크립트의 작성자는 이를 오픈소스로 공개하여 트레이더들이 기능을 검토하고 검증할 수 있도록 했습니다. 작성자에게 찬사를 보냅니다! 이 코드는 무료로 사용할 수 있지만, 코드를 재게시하는 경우 하우스 룰이 적용된다는 점을 기억하세요.
면책사항
해당 정보와 게시물은 금융, 투자, 트레이딩 또는 기타 유형의 조언이나 권장 사항으로 간주되지 않으며, 트레이딩뷰에서 제공하거나 보증하는 것이 아닙니다. 자세한 내용은 이용 약관을 참조하세요.