OPEN-SOURCE SCRIPT
Chanpreet RSI(3) Extreme Rays (4H, Adjustable Style)
Chanpreet RSI(3) Extreme Rays (4H)
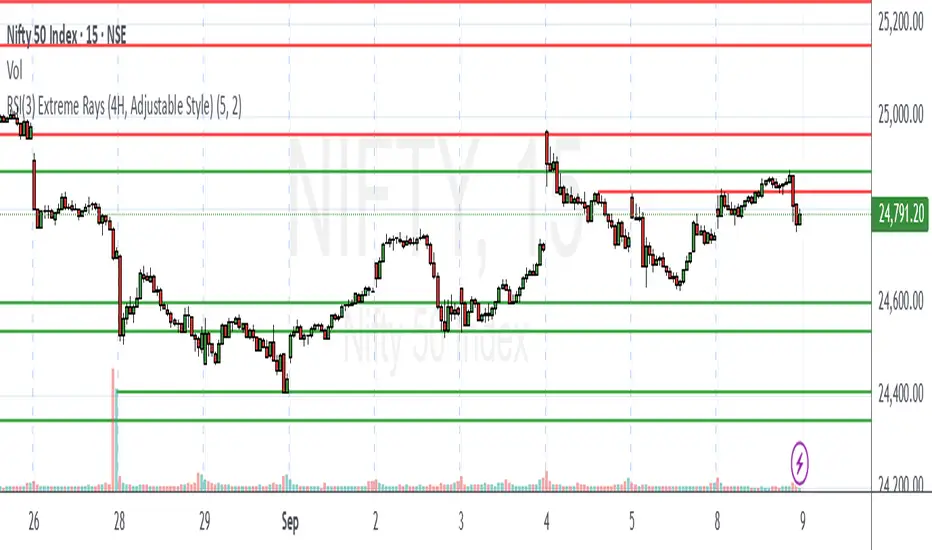
This indicator applies a short-length RSI (3) on the 4-hour timeframe and highlights momentum extremes directly on the chart.
🔎 What it does
Detects when RSI(3) moves into overbought (>80) or oversold (<20) territory.
Groups consecutive candles inside these zones into one “event” instead of marking each bar individually.
For each event:
• In overbought → records the highest high of the stretch and marks it with a horizontal ray.
• In oversold → records the lowest low of the stretch and marks it with a horizontal ray.
Keeps only the most recent N rays (default 5, adjustable).
⚙️ Inputs
Max Rays to Keep → how many unique events are kept visible.
Ray Thickness → adjust line thickness.
Overbought Ray Color → default red.
Oversold Ray Color → default green.
📈 How to use
Apply on any chart; RSI(3) values are always calculated from 4H data (via request.security).
Use rays as reference levels that highlight recent momentum extremes or exhaustion zones.
This is not a buy/sell signal by itself — combine with your own analysis, confirmation tools, and risk management.
Best Recommended time frame is 5 mins, 10 mins & 15 mins for intraday trading.
🧩 Unique features
Groups multiple bars into a single clean ray, reducing clutter.
Uses 4H RSI(3) regardless of the chart’s active timeframe.
Fully customizable appearance (colors, thickness, max events).
⚠️ Disclaimer
This script is provided for educational and informational purposes only.
It does not constitute financial advice or guarantee performance.
Always test thoroughly and use proper risk management before trading live.
오픈 소스 스크립트
트레이딩뷰의 진정한 정신에 따라, 이 스크립트의 작성자는 이를 오픈소스로 공개하여 트레이더들이 기능을 검토하고 검증할 수 있도록 했습니다. 작성자에게 찬사를 보냅니다! 이 코드는 무료로 사용할 수 있지만, 코드를 재게시하는 경우 하우스 룰이 적용된다는 점을 기억하세요.
면책사항
해당 정보와 게시물은 금융, 투자, 트레이딩 또는 기타 유형의 조언이나 권장 사항으로 간주되지 않으며, 트레이딩뷰에서 제공하거나 보증하는 것이 아닙니다. 자세한 내용은 이용 약관을 참조하세요.
오픈 소스 스크립트
트레이딩뷰의 진정한 정신에 따라, 이 스크립트의 작성자는 이를 오픈소스로 공개하여 트레이더들이 기능을 검토하고 검증할 수 있도록 했습니다. 작성자에게 찬사를 보냅니다! 이 코드는 무료로 사용할 수 있지만, 코드를 재게시하는 경우 하우스 룰이 적용된다는 점을 기억하세요.
면책사항
해당 정보와 게시물은 금융, 투자, 트레이딩 또는 기타 유형의 조언이나 권장 사항으로 간주되지 않으며, 트레이딩뷰에서 제공하거나 보증하는 것이 아닙니다. 자세한 내용은 이용 약관을 참조하세요.