OPEN-SOURCE SCRIPT
MARSI
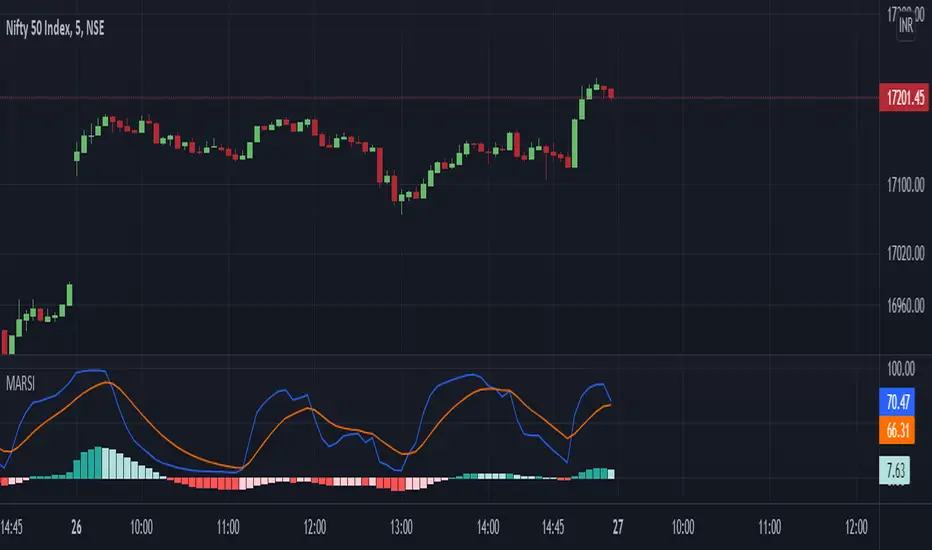
An advanced version of MACD and RSI combined, where moving averages gives quality early signals along with the strength of Histogram. This Version of MACD helps traders to understand strength in the Histogram and possibilities of a reversal. Indicator also gives Early Indications of trend shift.
MACD input options Given to User
The Indicator draws MACD and MACD Histogram
Based on histogram Value RSI is Plotted and RSI Based EMA is Plotted as MARSI line and Signal Line
Calculations :
MACD Line: (12-day EMA - 26-day EMA)
Signal Line: 9-day EMA of MACD Line
MACD Histogram: MACD Line - Signal Line
MARSI Line : RSI Value of MACD Histogram
Signal Line : 9-day EMA of Marsi Line
오픈 소스 스크립트
트레이딩뷰의 진정한 정신에 따라, 이 스크립트의 작성자는 이를 오픈소스로 공개하여 트레이더들이 기능을 검토하고 검증할 수 있도록 했습니다. 작성자에게 찬사를 보냅니다! 이 코드는 무료로 사용할 수 있지만, 코드를 재게시하는 경우 하우스 룰이 적용된다는 점을 기억하세요.
Capovex InvTech Limited
면책사항
해당 정보와 게시물은 금융, 투자, 트레이딩 또는 기타 유형의 조언이나 권장 사항으로 간주되지 않으며, 트레이딩뷰에서 제공하거나 보증하는 것이 아닙니다. 자세한 내용은 이용 약관을 참조하세요.
오픈 소스 스크립트
트레이딩뷰의 진정한 정신에 따라, 이 스크립트의 작성자는 이를 오픈소스로 공개하여 트레이더들이 기능을 검토하고 검증할 수 있도록 했습니다. 작성자에게 찬사를 보냅니다! 이 코드는 무료로 사용할 수 있지만, 코드를 재게시하는 경우 하우스 룰이 적용된다는 점을 기억하세요.
Capovex InvTech Limited
면책사항
해당 정보와 게시물은 금융, 투자, 트레이딩 또는 기타 유형의 조언이나 권장 사항으로 간주되지 않으며, 트레이딩뷰에서 제공하거나 보증하는 것이 아닙니다. 자세한 내용은 이용 약관을 참조하세요.