OPEN-SOURCE SCRIPT
Fibonacci Ranges (Real-Time) [LuxAlgo]

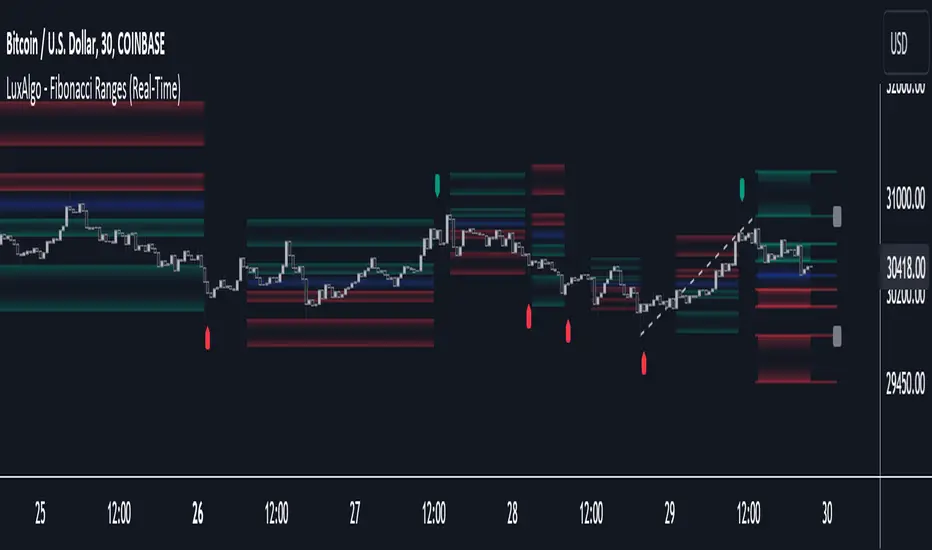
The "Fibonacci Ranges" indicator combines Fibonacci ratio-derived ranges (channels), together with a Fibonacci pattern of the latest swing high/low.
🔶 USAGE

The indicator draws real-time ranges based on Fibonacci ratios as well as retracements. Breakouts from a Fibonacci Channel are also indicated by labels, indicating a potential reversal.

Each range extremity/area can also be used as support/resistance.
🔶 CONCEPTS

Both, Latest Fibonacci and Fibonacci Channels, display different Fibonacci levels (labels not included in the code):

However, the 2 react in a totally different way.
🔹 Fibonacci Channels
2 conditions must be fulfilled until a Fibonacci Channel is displayed:

As visual guidance, chosen Break levels are accentuated by 2 small gray blocks:

Once the channel is displayed, it will remain visible until x consecutive bars break out of the chosen Break level at closing time.
• x consecutive bars is set by Break count.


The amount of breaks is counted in the code. When the price, without breaking the user-set limit, closes back between the 2 levels, the count is reset to 0.
By enabling Channels and Shadows you can see previous channels ("Shadows", which is always delayed with 1 bar)

Previous channels can be helpful in finding potential support/resistance areas, especially from large channel blocks

The more narrow Break levels are set the less chance the price closes between these 2 levels, and the quicker close breaks out.
In other words, narrow levels give fewer & smaller channels, broader levels give more & larger channels.
Note:
• swing settings: L & R
• Break count (x consecutive bars that close outside chosen levels to invalidate the Fibonacci Channel)
will also be of influence in displaying the channels.
• Show breaks enable you to visualize signals when there is a break:

• Alerts can also be set (Break Down/Break Up)
🔹 Latest Fibonacci
This displays the Fibonacci levels between the latest swing high and swing low, independently from the Fibonacci Channel.
The Lastest Fibonacci can be helpful in detecting the current trend against the larger Fibonacci Channel.

🔶 SETTINGS
🔹 Swing Settings
🔹 Fibonacci Channels
🔹 Fibonacci
🔶 USAGE
The indicator draws real-time ranges based on Fibonacci ratios as well as retracements. Breakouts from a Fibonacci Channel are also indicated by labels, indicating a potential reversal.
Each range extremity/area can also be used as support/resistance.
🔶 CONCEPTS
- Fibonacci Channels
- Latest Fibonacci
Both, Latest Fibonacci and Fibonacci Channels, display different Fibonacci levels (labels not included in the code):
However, the 2 react in a totally different way.
🔹 Fibonacci Channels
2 conditions must be fulfilled until a Fibonacci Channel is displayed:
- New swing high/low
- close has to be between chosen limits/levels (Break level)
As visual guidance, chosen Break levels are accentuated by 2 small gray blocks:
Once the channel is displayed, it will remain visible until x consecutive bars break out of the chosen Break level at closing time.
• x consecutive bars is set by Break count.
The amount of breaks is counted in the code. When the price, without breaking the user-set limit, closes back between the 2 levels, the count is reset to 0.
By enabling Channels and Shadows you can see previous channels ("Shadows", which is always delayed with 1 bar)
Previous channels can be helpful in finding potential support/resistance areas, especially from large channel blocks
The more narrow Break levels are set the less chance the price closes between these 2 levels, and the quicker close breaks out.
In other words, narrow levels give fewer & smaller channels, broader levels give more & larger channels.
Note:
• swing settings: L & R
• Break count (x consecutive bars that close outside chosen levels to invalidate the Fibonacci Channel)
will also be of influence in displaying the channels.
• Show breaks enable you to visualize signals when there is a break:
• Alerts can also be set (Break Down/Break Up)
🔹 Latest Fibonacci
This displays the Fibonacci levels between the latest swing high and swing low, independently from the Fibonacci Channel.
The Lastest Fibonacci can be helpful in detecting the current trend against the larger Fibonacci Channel.
🔶 SETTINGS
🔹 Swing Settings
🔹 Fibonacci Channels
- Channel: Channel / Channels + Shadows / None
- Break level
-0.382 - 1.382
0.000 - 1.000
0.236 - 0.764
0.382 - 0.618 - Break count
🔹 Fibonacci
- Toggle
- Colours: [[]-0.382 - 0[]], [[]0.236 - 0.382[]], [[]0.5[]], [[]0.618 - 0.764[]], [[]1 - 1.382[]]
오픈 소스 스크립트
트레이딩뷰의 진정한 정신에 따라, 이 스크립트의 작성자는 이를 오픈소스로 공개하여 트레이더들이 기능을 검토하고 검증할 수 있도록 했습니다. 작성자에게 찬사를 보냅니다! 이 코드는 무료로 사용할 수 있지만, 코드를 재게시하는 경우 하우스 룰이 적용된다는 점을 기억하세요.
Get exclusive indicators & AI trading strategies: luxalgo.com
Free 150k+ community: discord.gg/lux
All content provided by LuxAlgo is for informational & educational purposes only. Past performance does not guarantee future results.
Free 150k+ community: discord.gg/lux
All content provided by LuxAlgo is for informational & educational purposes only. Past performance does not guarantee future results.
면책사항
해당 정보와 게시물은 금융, 투자, 트레이딩 또는 기타 유형의 조언이나 권장 사항으로 간주되지 않으며, 트레이딩뷰에서 제공하거나 보증하는 것이 아닙니다. 자세한 내용은 이용 약관을 참조하세요.