OPEN-SOURCE SCRIPT
업데이트됨 Juice Levels
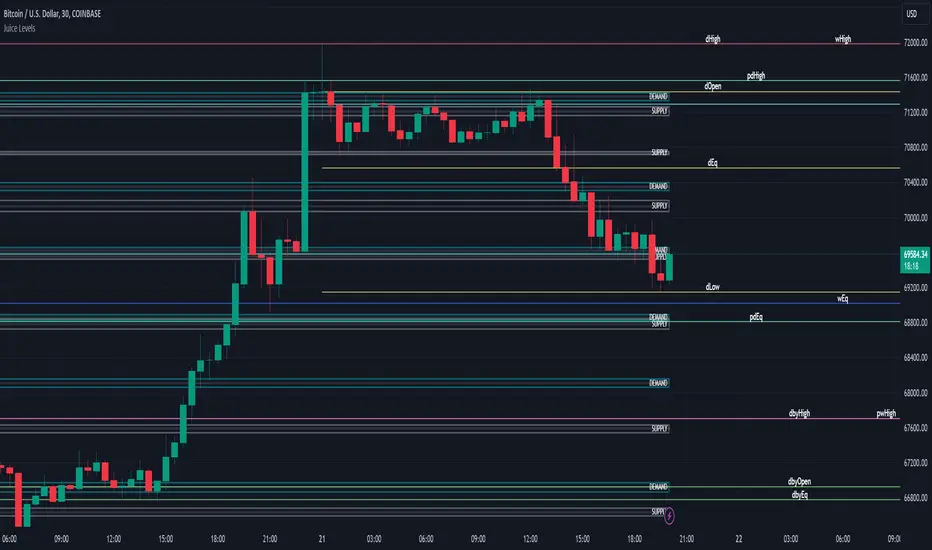
Supply and Demand Key Levels
These levels encompass key price points derived from various timeframes, providing crucial insights into market dynamics and potential trading opportunities. These levels include daily, prior day, day before yesterday, weekly, prior weekly, monthly, and prior monthly levels.
Daily, Prior Day, Day Before Yesterday Levels
Offer intraday reference points and historical context for analyzing short-term price movements.
Weekly, Prior Weekly Levels
Provide insights into longer-term trends and potential areas of price consolidation or breakout over a one-week timeframe.
Monthly, Prior Monthly Levels
Offer significant insights into macroeconomic trends and investor sentiment over longer timeframes, spanning one month.
Equilibrium Levels
Indicate points where supply and demand are relatively balanced, often serving as pivot points for price movements.
Supply and Demand Zones
Highlight areas on a price chart where significant buying or selling pressure is expected, aiding traders in identifying potential reversal or breakout zones.
These levels and zones are essential tools for traders to analyze market sentiment, identify support and resistance levels, and make informed trading decisions across various timeframes.
릴리즈 노트
- Added options to enable / disable every line per period오픈 소스 스크립트
트레이딩뷰의 진정한 정신에 따라, 이 스크립트의 작성자는 이를 오픈소스로 공개하여 트레이더들이 기능을 검토하고 검증할 수 있도록 했습니다. 작성자에게 찬사를 보냅니다! 이 코드는 무료로 사용할 수 있지만, 코드를 재게시하는 경우 하우스 룰이 적용된다는 점을 기억하세요.
- Juice Signals™
면책사항
해당 정보와 게시물은 금융, 투자, 트레이딩 또는 기타 유형의 조언이나 권장 사항으로 간주되지 않으며, 트레이딩뷰에서 제공하거나 보증하는 것이 아닙니다. 자세한 내용은 이용 약관을 참조하세요.
오픈 소스 스크립트
트레이딩뷰의 진정한 정신에 따라, 이 스크립트의 작성자는 이를 오픈소스로 공개하여 트레이더들이 기능을 검토하고 검증할 수 있도록 했습니다. 작성자에게 찬사를 보냅니다! 이 코드는 무료로 사용할 수 있지만, 코드를 재게시하는 경우 하우스 룰이 적용된다는 점을 기억하세요.
- Juice Signals™
면책사항
해당 정보와 게시물은 금융, 투자, 트레이딩 또는 기타 유형의 조언이나 권장 사항으로 간주되지 않으며, 트레이딩뷰에서 제공하거나 보증하는 것이 아닙니다. 자세한 내용은 이용 약관을 참조하세요.