INVITE-ONLY SCRIPT
업데이트됨 The Multi Touch Confluence Indicator Subplot
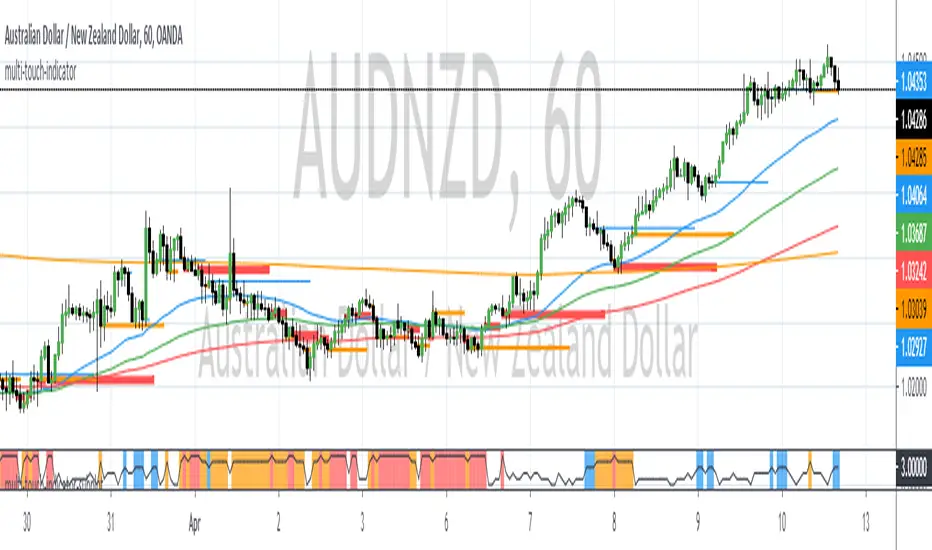
The Multi Touch EMA Confluence Indicator Subplot identifies zones where EMAs across 6 different time frames are within a specified range in proximity of the close value. These zones indicate confluence of EMAs.
The confluence zone is specified as a point difference.
When confluence is found, the indicator will paint vertical lines of different color and width.
The maximum number of time frames being used is 6.
The maximum number of EMAs per time frame is 4.
When confluence occurs it usually indicates a precursor of price expansion. This indicator can be used to determine when momentum is about to come back into the market.
The confluence zone is specified as a point difference.
When confluence is found, the indicator will paint vertical lines of different color and width.
- Blue Zones indicate a confluence of 3 EMAs across all time frames
- Orange Zones indicate a confluence of 4 EMAs across all time frames
- Red Zones indicate a confluence of 5 or more EMAs across all time frames.
The maximum number of time frames being used is 6.
The maximum number of EMAs per time frame is 4.
When confluence occurs it usually indicates a precursor of price expansion. This indicator can be used to determine when momentum is about to come back into the market.
릴리즈 노트
fix: Refined confluence algorithm thresholds. 초대 전용 스크립트
이 스크립트는 작성자가 승인한 사용자만 접근할 수 있습니다. 사용하려면 요청 후 승인을 받아야 하며, 일반적으로 결제 후에 허가가 부여됩니다. 자세한 내용은 아래 작성자의 안내를 따르거나 LiquidityTracker에게 직접 문의하세요.
트레이딩뷰는 스크립트의 작동 방식을 충분히 이해하고 작성자를 완전히 신뢰하지 않는 이상, 해당 스크립트에 비용을 지불하거나 사용하는 것을 권장하지 않습니다. 커뮤니티 스크립트에서 무료 오픈소스 대안을 찾아보실 수도 있습니다.
작성자 지시 사항
면책사항
해당 정보와 게시물은 금융, 투자, 트레이딩 또는 기타 유형의 조언이나 권장 사항으로 간주되지 않으며, 트레이딩뷰에서 제공하거나 보증하는 것이 아닙니다. 자세한 내용은 이용 약관을 참조하세요.
초대 전용 스크립트
이 스크립트는 작성자가 승인한 사용자만 접근할 수 있습니다. 사용하려면 요청 후 승인을 받아야 하며, 일반적으로 결제 후에 허가가 부여됩니다. 자세한 내용은 아래 작성자의 안내를 따르거나 LiquidityTracker에게 직접 문의하세요.
트레이딩뷰는 스크립트의 작동 방식을 충분히 이해하고 작성자를 완전히 신뢰하지 않는 이상, 해당 스크립트에 비용을 지불하거나 사용하는 것을 권장하지 않습니다. 커뮤니티 스크립트에서 무료 오픈소스 대안을 찾아보실 수도 있습니다.
작성자 지시 사항
면책사항
해당 정보와 게시물은 금융, 투자, 트레이딩 또는 기타 유형의 조언이나 권장 사항으로 간주되지 않으며, 트레이딩뷰에서 제공하거나 보증하는 것이 아닙니다. 자세한 내용은 이용 약관을 참조하세요.