INVITE-ONLY SCRIPT
dize Multi-Timeframe Power Index
Hi Trader,
the "Power Index" indicator is one part of our holistic approach to identifying trading setups. It is one of many indcators of our dize indicator package and should always be used in conjunction with the other dize indicators.
💡 What is the Power Index?
The "Power Index" indicator is our approach to measuring the volatility of an asset. It comes with multi-timeframe support, which helps to filter out bad trades. The indicator has a "Sensitivity" parameter that specifies how many historic candles should be looked at when calculating. The graph is a cloud colored according to historical volatility. This makes it possible to estimate at a glance how much risk and volatility currently prevail in the market.
💡How to use it?
By using the integrated settings you will be able to configure the power index for your market. Firstly, you should find the "Sensitivity" which best reflects your markets volatility. If you wish, you can also use the indicator on a different timeframe, than the one displayed on your chart. That can help to filter out noise and get a better perspective on what is happening on a bigger timeframe.
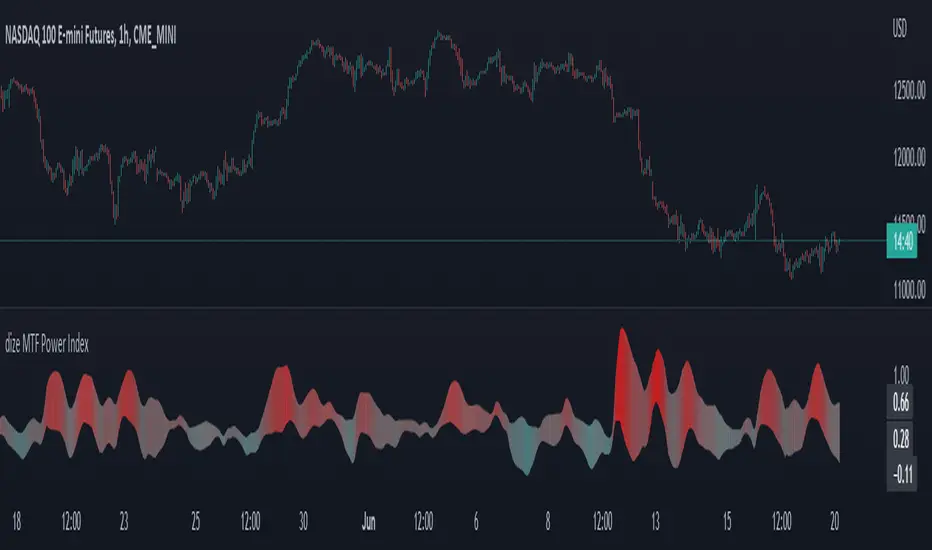
Let's have a look how we can use the Power Index to filter out noise on a lower timeframe:

In the above picture, both chart and power index run on the same timeframe. The Power Index calculates according to the selected timeframe and gives solid information.

If we zoom out on the power index by selecting a higher timeframe, we get the big picture and can easily identify low volatility, which might increase our chances on finding a good trading setup.
The above example is one of many use cases for the power index indicator.
🔓 To gain access to this indicator, please read the signature field.
the "Power Index" indicator is one part of our holistic approach to identifying trading setups. It is one of many indcators of our dize indicator package and should always be used in conjunction with the other dize indicators.
💡 What is the Power Index?
The "Power Index" indicator is our approach to measuring the volatility of an asset. It comes with multi-timeframe support, which helps to filter out bad trades. The indicator has a "Sensitivity" parameter that specifies how many historic candles should be looked at when calculating. The graph is a cloud colored according to historical volatility. This makes it possible to estimate at a glance how much risk and volatility currently prevail in the market.
💡How to use it?
By using the integrated settings you will be able to configure the power index for your market. Firstly, you should find the "Sensitivity" which best reflects your markets volatility. If you wish, you can also use the indicator on a different timeframe, than the one displayed on your chart. That can help to filter out noise and get a better perspective on what is happening on a bigger timeframe.
Let's have a look how we can use the Power Index to filter out noise on a lower timeframe:
In the above picture, both chart and power index run on the same timeframe. The Power Index calculates according to the selected timeframe and gives solid information.
If we zoom out on the power index by selecting a higher timeframe, we get the big picture and can easily identify low volatility, which might increase our chances on finding a good trading setup.
The above example is one of many use cases for the power index indicator.
🔓 To gain access to this indicator, please read the signature field.
초대 전용 스크립트
이 스크립트는 작성자가 승인한 사용자만 접근할 수 있습니다. 사용하려면 요청 후 승인을 받아야 하며, 일반적으로 결제 후에 허가가 부여됩니다. 자세한 내용은 아래 작성자의 안내를 따르거나 paaax에게 직접 문의하세요.
트레이딩뷰는 스크립트의 작동 방식을 충분히 이해하고 작성자를 완전히 신뢰하지 않는 이상, 해당 스크립트에 비용을 지불하거나 사용하는 것을 권장하지 않습니다. 커뮤니티 스크립트에서 무료 오픈소스 대안을 찾아보실 수도 있습니다.
작성자 지시 사항
🔓To gain access to the dize indicator package, please subscribe on our website http://www.dize-trading.de
🔒For trial access please follow the instructions on our discord: https://discord.gg/DqwKjBZ8Qe
🙋♂️Listed as "Trusted Pine Programmer for Hire"
💰Save $30 on your Tradingview subscription: bit.ly/3OtLyNz
🔓Indicator access: dize-trading.de/
🔒Trial access: discord.gg/DqwKjBZ8Qe
💰Save $30 on your Tradingview subscription: bit.ly/3OtLyNz
🔓Indicator access: dize-trading.de/
🔒Trial access: discord.gg/DqwKjBZ8Qe
면책사항
해당 정보와 게시물은 금융, 투자, 트레이딩 또는 기타 유형의 조언이나 권장 사항으로 간주되지 않으며, 트레이딩뷰에서 제공하거나 보증하는 것이 아닙니다. 자세한 내용은 이용 약관을 참조하세요.