PROTECTED SOURCE SCRIPT
Z_MUTIL_CANDEL_v1
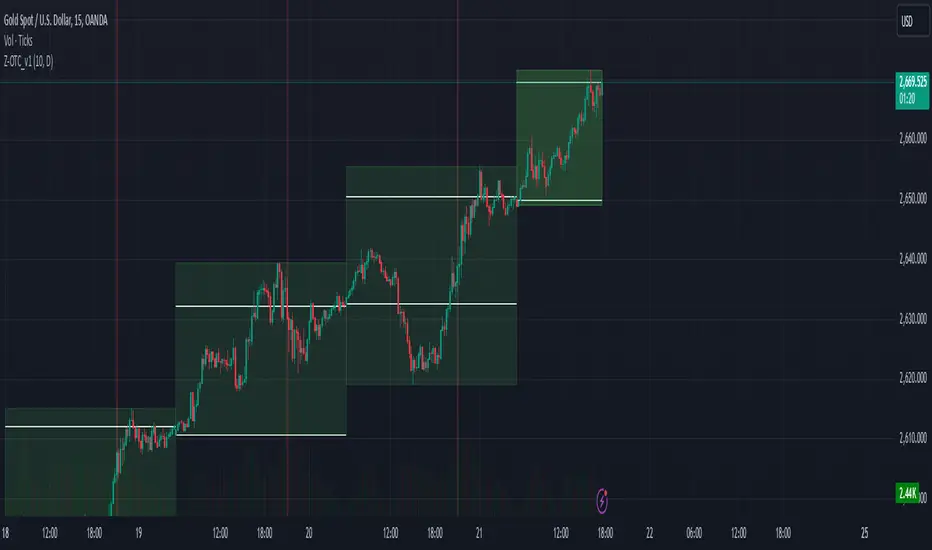
The Z_MUTIL_CANDEL_v1 indicator is designed to visually represent detailed candlestick information on a chart, overlaying multiple custom candlesticks based on a selected timeframe. This tool provides an enhanced visual understanding of price dynamics, making it easier to analyze trends and volatility.
Key Features:
Customizable Timeframe:
The indicator allows users to select a custom timeframe (default: Daily).
Displays candlestick data (Open, High, Low, Close) from the chosen timeframe.
Custom Candlestick Drawing:
Draws additional candlesticks at customizable positions to visualize key price levels:
Open/Close lines: Highlighted with solid white horizontal lines.
High/Low boxes: Represent the candlestick body and shadows with adjustable colors.
Candlestick colors:
Green: For bullish candles (Close >= Open).
Red: For bearish candles (Close < Open).
Detailed Labels:
Displays information next to the candlestick, including:
The selected timeframe.
Time left for the current bar to close (in HH:mm
format).
The candlestick range (High - Low).
Dynamic Background Highlight:
Highlights the chart's background in red with 80% transparency during a specific time (e.g., 9:00 AM to 9:01 AM).
Customizable Inputs:
Body size (pixels): Adjustable position of the custom candlesticks on the chart.
Show Candlestick Option: Option to display or hide the additional candlesticks.
Multiple Candlestick Layers:
Supports overlaying multiple custom candlesticks for comparison or enhanced visualization.
Practical Applications:
Enhanced Market Analysis: Use the detailed candlestick visuals and labels to better understand price movements and identify potential trading opportunities.
Timeframe Comparison: Compare custom timeframe candles against the current chart for multi-timeframe analysis.
Critical Time Identification: Highlight and analyze market behavior during specific hours using the background coloring feature.
How to Use:
Add the Indicator to Your Chart:
Open the TradingView editor and apply the script.
Adjust the settings to match your analysis needs.
Analyze Custom Candlesticks:
Observe the additional candlesticks and their corresponding data (timeframe, price range, etc.).
Leverage Time-Based Insights:
Use the countdown timer to monitor session closures or key levels around specific times.
Enhance your trading insights by utilizing the Z_MUTIL_CANDEL_v1 indicator for detailed candlestick visualization and analysis. 🚀
보호된 스크립트입니다
이 스크립트는 비공개 소스로 게시됩니다. 하지만 이를 자유롭게 제한 없이 사용할 수 있습니다 – 자세한 내용은 여기에서 확인하세요.
면책사항
해당 정보와 게시물은 금융, 투자, 트레이딩 또는 기타 유형의 조언이나 권장 사항으로 간주되지 않으며, 트레이딩뷰에서 제공하거나 보증하는 것이 아닙니다. 자세한 내용은 이용 약관을 참조하세요.
보호된 스크립트입니다
이 스크립트는 비공개 소스로 게시됩니다. 하지만 이를 자유롭게 제한 없이 사용할 수 있습니다 – 자세한 내용은 여기에서 확인하세요.
면책사항
해당 정보와 게시물은 금융, 투자, 트레이딩 또는 기타 유형의 조언이나 권장 사항으로 간주되지 않으며, 트레이딩뷰에서 제공하거나 보증하는 것이 아닙니다. 자세한 내용은 이용 약관을 참조하세요.