PROTECTED SOURCE SCRIPT
업데이트됨 Fight Or Flight Index [log] - LTF [MethodAlgo]
Introduction:
"Fight Or Flight" is a robust yet user-friendly indicator designed for long-term cycle analysis and gauging market sentiment. Excluded from our Premium Indicator Collection, we are delighted to offer this tool to the community for free.
Before Use:
- This is a first-layer analysis tool, identifying potential over/under-valued price areas, not predicting future market movements.
- Tailored for long-term investment analysis. Designed for use on timeframes "1D" and above; unsupported timeframes will display nothing.
- If the asset has less 2 years of data, indicator will display nothing.
Concept:
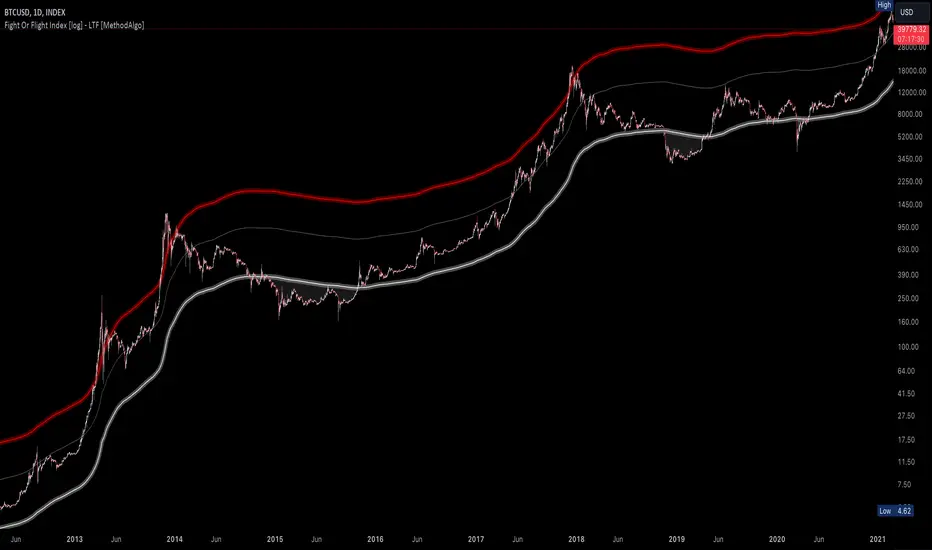
Fight Or Flight utilizes a 2-year Moving Average (MA) as a baseline (neon white), with reference lines at 2.5x and 5x of the MA (white and neon red). By tracking asset movements through bear and bull market cycles, the indicator simplifies the identification of these cycles for long-term investors.
Instructions:
- Supported timeframes: 1D, 3D, 1W, 2W, 3W, 9W, 1M, 3M, 6M, 12M; auto-adjusts MA parameters for listed timeframes for the same result.
- Recommended to use log chart for clearer views; supports all chart types but functions optimally in log mode. or the upper channel line will look odd (but not wrong).
- Set up advice: Use the indicator in a separate chart with a fixed timeframe.

UI:
- Neon White: Indicates market bottom, a 2-year MA auto-adjusted for the supported timeframe.
- Neon Red: Indicates market top, set at 5x the 2-year MA.
- White: Sits between the top and bottom lines, serving as a support, resistance, or equilibrium line.
- Filled Area: Red (Flight) signals an overheated market, suggesting an exit; White (Fight) denotes an undervalued market, suggesting an possible entry.
Use Case:
Traders can observe price levels in comparison to the MA levels provided by the indicator for cycle analysis:
- Below Neon White: Indicates undervalue, over-pessimistic market conditions; potential for outsized returns.
- Near or above Neon Red: Suggests an overvalued or overexcited market; plan your exit strategy.
Risk Disclaimer:
Trading is inherently risky; this indicator provides indications based on historical data, and past performance does not guarantee future results. Use it as part of your confluence reference and avoid making trading decisions solely based on one indicator.
"Fight Or Flight" is a robust yet user-friendly indicator designed for long-term cycle analysis and gauging market sentiment. Excluded from our Premium Indicator Collection, we are delighted to offer this tool to the community for free.
Before Use:
- This is a first-layer analysis tool, identifying potential over/under-valued price areas, not predicting future market movements.
- Tailored for long-term investment analysis. Designed for use on timeframes "1D" and above; unsupported timeframes will display nothing.
- If the asset has less 2 years of data, indicator will display nothing.
Concept:
Fight Or Flight utilizes a 2-year Moving Average (MA) as a baseline (neon white), with reference lines at 2.5x and 5x of the MA (white and neon red). By tracking asset movements through bear and bull market cycles, the indicator simplifies the identification of these cycles for long-term investors.
Instructions:
- Supported timeframes: 1D, 3D, 1W, 2W, 3W, 9W, 1M, 3M, 6M, 12M; auto-adjusts MA parameters for listed timeframes for the same result.
- Recommended to use log chart for clearer views; supports all chart types but functions optimally in log mode. or the upper channel line will look odd (but not wrong).
- Set up advice: Use the indicator in a separate chart with a fixed timeframe.
UI:
- Neon White: Indicates market bottom, a 2-year MA auto-adjusted for the supported timeframe.
- Neon Red: Indicates market top, set at 5x the 2-year MA.
- White: Sits between the top and bottom lines, serving as a support, resistance, or equilibrium line.
- Filled Area: Red (Flight) signals an overheated market, suggesting an exit; White (Fight) denotes an undervalued market, suggesting an possible entry.
Use Case:
Traders can observe price levels in comparison to the MA levels provided by the indicator for cycle analysis:
- Below Neon White: Indicates undervalue, over-pessimistic market conditions; potential for outsized returns.
- Near or above Neon Red: Suggests an overvalued or overexcited market; plan your exit strategy.
Risk Disclaimer:
Trading is inherently risky; this indicator provides indications based on historical data, and past performance does not guarantee future results. Use it as part of your confluence reference and avoid making trading decisions solely based on one indicator.
릴리즈 노트
uptate name : sorry , the script name was wrong and can't be edit, the indicator is for HTF, not LTF릴리즈 노트
add support to display in all TFs. so you dont have to switch chart over and overs.but still recommend to use on 1D and above , in LTF , the insights offered is limited as this channel update very slow.
보호된 스크립트입니다
이 스크립트는 비공개 소스로 게시됩니다. 하지만 이를 자유롭게 제한 없이 사용할 수 있습니다 – 자세한 내용은 여기에서 확인하세요.
Target Higher, Aim Better.
Try MethodAlgo today:)
Try MethodAlgo today:)
면책사항
해당 정보와 게시물은 금융, 투자, 트레이딩 또는 기타 유형의 조언이나 권장 사항으로 간주되지 않으며, 트레이딩뷰에서 제공하거나 보증하는 것이 아닙니다. 자세한 내용은 이용 약관을 참조하세요.
보호된 스크립트입니다
이 스크립트는 비공개 소스로 게시됩니다. 하지만 이를 자유롭게 제한 없이 사용할 수 있습니다 – 자세한 내용은 여기에서 확인하세요.
Target Higher, Aim Better.
Try MethodAlgo today:)
Try MethodAlgo today:)
면책사항
해당 정보와 게시물은 금융, 투자, 트레이딩 또는 기타 유형의 조언이나 권장 사항으로 간주되지 않으며, 트레이딩뷰에서 제공하거나 보증하는 것이 아닙니다. 자세한 내용은 이용 약관을 참조하세요.