OPEN-SOURCE SCRIPT
Average Volume Label
Average Volume Label Indicator
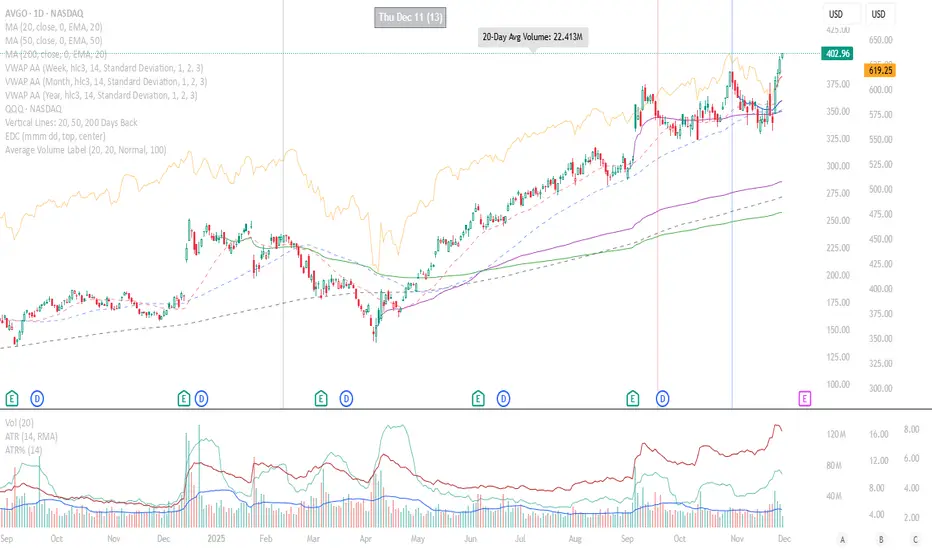
This TradingView Pine Script creates a customizable label that displays the average trading volume over a specified period directly on your price chart.
Core Functionality:
Calculates the simple moving average (SMA) of volume over a user-defined number of days (default: 20 days)
Displays this average in a positioned label at the top of the chart
The label shows text like "20-Day Avg Volume: 1.2M" with automatic volume formatting
Key Customization Options:
Volume Calculation:
Adjustable lookback period (1-200 days) for the volume average
Label Appearance:
Text color, background color, and transparency controls
Five size options (Tiny to Huge)
Configurable horizontal position (how many bars back from the current bar to place the label)
Technical Implementation:
Updates only on the most recent bar to optimize performance
Positions the label at the highest price point within the visible range for consistent top-of-chart placement
Includes safety checks to prevent runtime errors with lookback periods
Also plots the average volume data (visible in the data window for reference)
This indicator is useful for traders who want to quickly assess whether current volume is above or below the recent average without cluttering their chart with additional panes.
오픈 소스 스크립트
트레이딩뷰의 진정한 정신에 따라, 이 스크립트의 작성자는 이를 오픈소스로 공개하여 트레이더들이 기능을 검토하고 검증할 수 있도록 했습니다. 작성자에게 찬사를 보냅니다! 이 코드는 무료로 사용할 수 있지만, 코드를 재게시하는 경우 하우스 룰이 적용된다는 점을 기억하세요.
면책사항
해당 정보와 게시물은 금융, 투자, 트레이딩 또는 기타 유형의 조언이나 권장 사항으로 간주되지 않으며, 트레이딩뷰에서 제공하거나 보증하는 것이 아닙니다. 자세한 내용은 이용 약관을 참조하세요.
오픈 소스 스크립트
트레이딩뷰의 진정한 정신에 따라, 이 스크립트의 작성자는 이를 오픈소스로 공개하여 트레이더들이 기능을 검토하고 검증할 수 있도록 했습니다. 작성자에게 찬사를 보냅니다! 이 코드는 무료로 사용할 수 있지만, 코드를 재게시하는 경우 하우스 룰이 적용된다는 점을 기억하세요.
면책사항
해당 정보와 게시물은 금융, 투자, 트레이딩 또는 기타 유형의 조언이나 권장 사항으로 간주되지 않으며, 트레이딩뷰에서 제공하거나 보증하는 것이 아닙니다. 자세한 내용은 이용 약관을 참조하세요.