INVITE-ONLY SCRIPT
VolatilityCone by ImpliedVolatility Pro
VolatilityCone by ImpliedVolatility Pro
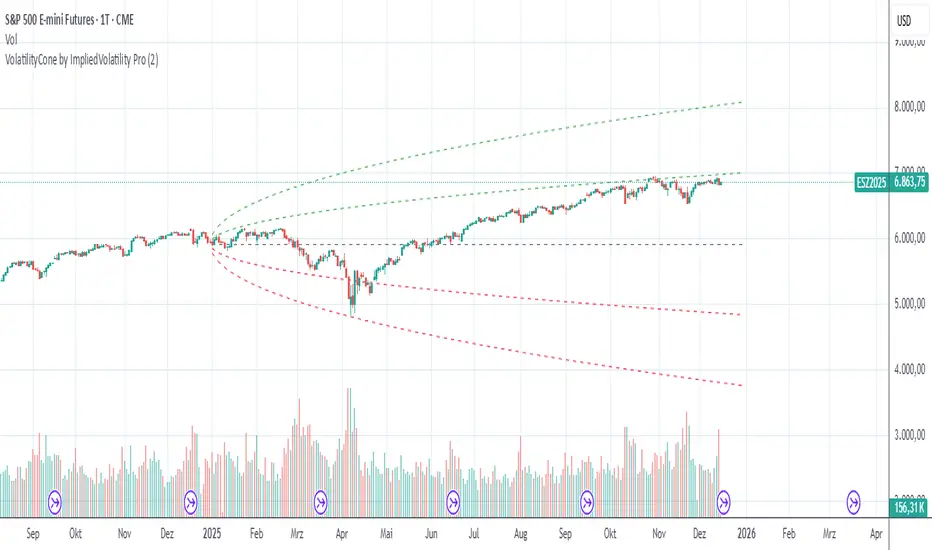
VolatilityCone by ImpliedVolatility Pro is a forward-looking volatility projection tool that visualizes expected price ranges based on implied volatility.
It draws a volatility cone starting from a user-defined date and projects statistically expected price boundaries into the future using standard deviation theory.
🔍 What does this indicator do?
This indicator calculates and plots price ranges that represent ±1, ±2, and ±3 standard deviations from a starting price, based on implied volatility.
The result is a cone-shaped projection that shows where price is statistically likely to move over time.
In addition, the indicator calculates a Z-Score, showing how far the current price deviates from the expected mean in volatility terms.
📐 Key Features
→ Forward projection based on implied volatility
→ Supports up to 3 standard deviation levels
→ Optional display of half standard deviation levels
→ Manually enter implied volatility or automatically fetch IV from another symbol (e.g. VIX)
→ Custom Start Date
→ The cone starts exactly at the selected date
→ Ideal for earnings, events, or cycle-based analysis
→ Displays the statistical mean price
→ Z-Score indicates how extreme the current price is relative to the cone
📊 How to Use
Price inside the cone
→ Normal volatility behavior
Price near ±1σ
→ Typical volatility range
Price near ±2σ or ±3σ
→ Statistically stretched or extreme conditions
Positive Z-Score
→ Price trading above the mean
Negative Z-Score
→ Price trading below the mean
This makes the indicator useful for:
→ Volatility analysis
→ Mean reversion strategies
→ Risk assessment
→ Event-based forecasting
→ Options-related analysis
⚙️ Notes & Disclaimer
This indicator is not a prediction tool, but a statistical projection
It assumes volatility follows a square-root-of-time model
Best used as a context tool, not as a standalone trading signal
초대 전용 스크립트
이 스크립트는 작성자가 승인한 사용자만 접근할 수 있습니다. 사용하려면 요청 후 승인을 받아야 하며, 일반적으로 결제 후에 허가가 부여됩니다. 자세한 내용은 아래 작성자의 안내를 따르거나 bronko791에게 직접 문의하세요.
트레이딩뷰는 스크립트의 작동 방식을 충분히 이해하고 작성자를 완전히 신뢰하지 않는 이상, 해당 스크립트에 비용을 지불하거나 사용하는 것을 권장하지 않습니다. 커뮤니티 스크립트에서 무료 오픈소스 대안을 찾아보실 수도 있습니다.
작성자 지시 사항
Send a private message.
면책사항
해당 정보와 게시물은 금융, 투자, 트레이딩 또는 기타 유형의 조언이나 권장 사항으로 간주되지 않으며, 트레이딩뷰에서 제공하거나 보증하는 것이 아닙니다. 자세한 내용은 이용 약관을 참조하세요.