OPEN-SOURCE SCRIPT
업데이트됨 Day Week Month High & Low

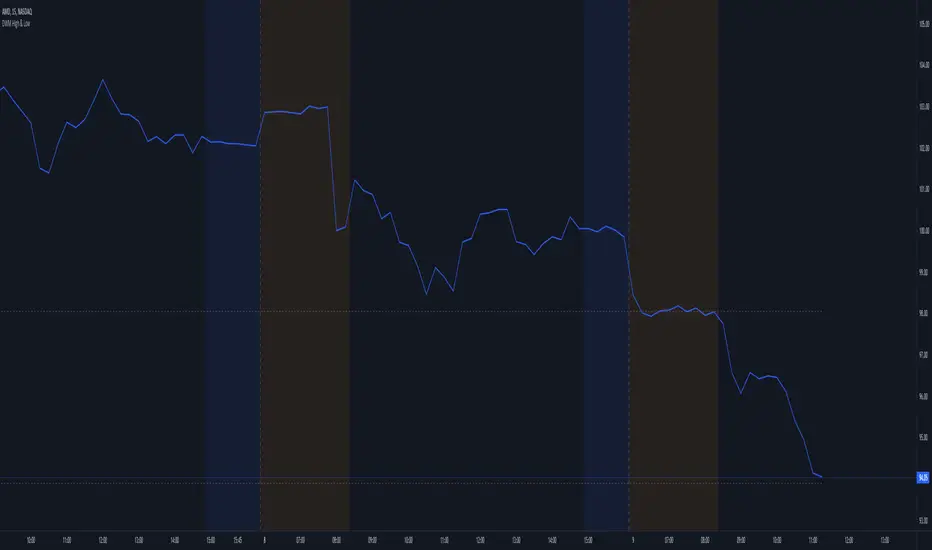
This is a small little script that helps visually mark the high and lows of the DAY, WEEK or MONTH (of your choosing). It's best when paired with my High and Low Fibonacci Pivot Points indicator to help emphasize the high and lows of the day, week or month.
릴리즈 노트
Added a 2-Day high and low setting. This was added as an inquiry about a modification for a 2-Day high and low.릴리즈 노트
Added some additional visual updates. I wasn't planning on releasing any additional updates, since I keep getting hit with infractions for my scripts being deemed as not original (although it's 100% my own work), nor not colorful/exciting to look at. Since, I've been receiving kind feedbacks from a user or two, I've released this update to the public.Updates Include:
- Allowing you to choose the line style (dashed, dotted or solid)
- Added an additional 1-Hour timeframe selection (for those who like to scalp with tight entries & stops)
- For those who set the timeframe to DAY, can choose to enable the lines to alternate to a different color, when the DAY high matches the WEEK high and the same is applied when the DAY low matches the WEEK low. This could be useful for those who swing trade on a weekly basis (i.e. open & close trades within the same week).
오픈 소스 스크립트
트레이딩뷰의 진정한 정신에 따라, 이 스크립트의 작성자는 이를 오픈소스로 공개하여 트레이더들이 기능을 검토하고 검증할 수 있도록 했습니다. 작성자에게 찬사를 보냅니다! 이 코드는 무료로 사용할 수 있지만, 코드를 재게시하는 경우 하우스 룰이 적용된다는 점을 기억하세요.
면책사항
해당 정보와 게시물은 금융, 투자, 트레이딩 또는 기타 유형의 조언이나 권장 사항으로 간주되지 않으며, 트레이딩뷰에서 제공하거나 보증하는 것이 아닙니다. 자세한 내용은 이용 약관을 참조하세요.
오픈 소스 스크립트
트레이딩뷰의 진정한 정신에 따라, 이 스크립트의 작성자는 이를 오픈소스로 공개하여 트레이더들이 기능을 검토하고 검증할 수 있도록 했습니다. 작성자에게 찬사를 보냅니다! 이 코드는 무료로 사용할 수 있지만, 코드를 재게시하는 경우 하우스 룰이 적용된다는 점을 기억하세요.
면책사항
해당 정보와 게시물은 금융, 투자, 트레이딩 또는 기타 유형의 조언이나 권장 사항으로 간주되지 않으며, 트레이딩뷰에서 제공하거나 보증하는 것이 아닙니다. 자세한 내용은 이용 약관을 참조하세요.