OPEN-SOURCE SCRIPT
업데이트됨 Stochastic Trend mtf
Definition
The Stochastic RSI indicator (Stoch RSI) is actually an indicator of an indicator. It is used in technical analysis to provide a stochastic calculation to the RSI indicator. This means it's an RSI measure relative to its own high/low range over a user-defined time period. Stochastic RSI is an oscillator that calculates a value between 0 and 1 and then plots it as a line. This indicator is primarily used to identify overbought and oversold conditions.
It is important to remember that the Stoch RSI is an indicator of an indicator that is two steps away from the price. The RSI is one step away from the price and therefore a stochastic calculation of the RSI is two steps away. This is important because as with any indicator that is more than one step away from price, the Stoch RSI can be short-term disconnected from actual price action. However, as a range-bound indicator, the Stoch RSI's primary function is to identify cross-bought, overbought and oversold conditions.
Use
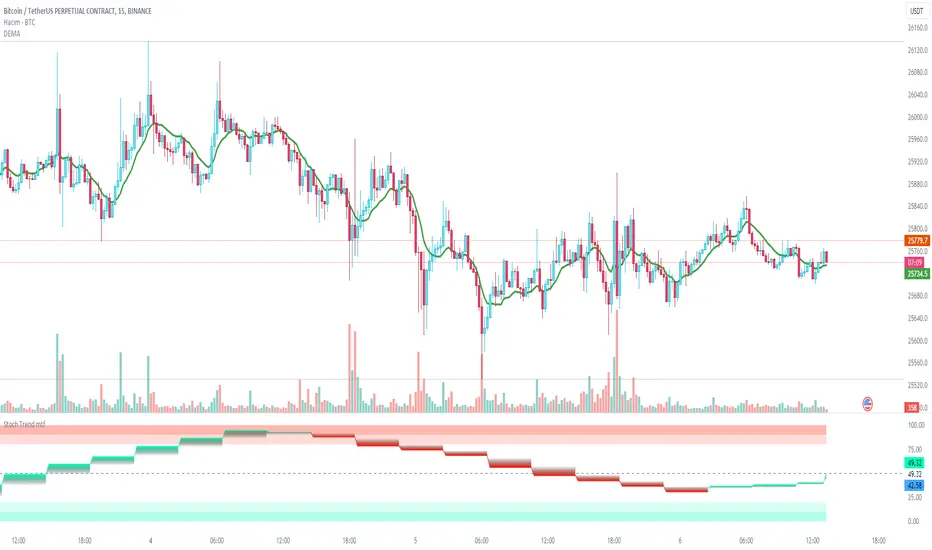
When we integrate it into our chart in the upper time frame, it both gives the direction of the trend more healthy and is more efficient in terms of noise reduction in terms of leaving the overbought-sold zones. Unlike the classic stochastic, I set the "d" value to 8. Even though the trend returns are a little late, we see healthier data on our graph. Trend changes in overbought zones are getting stronger. Coloring red indicates that the trend is selling, while painting green indicates that the trend is buying. I hope you find it useful, if you have any questions or suggestions, please feel free to ask.
Good luck...
It is not investment advice.
The Stochastic RSI indicator (Stoch RSI) is actually an indicator of an indicator. It is used in technical analysis to provide a stochastic calculation to the RSI indicator. This means it's an RSI measure relative to its own high/low range over a user-defined time period. Stochastic RSI is an oscillator that calculates a value between 0 and 1 and then plots it as a line. This indicator is primarily used to identify overbought and oversold conditions.
It is important to remember that the Stoch RSI is an indicator of an indicator that is two steps away from the price. The RSI is one step away from the price and therefore a stochastic calculation of the RSI is two steps away. This is important because as with any indicator that is more than one step away from price, the Stoch RSI can be short-term disconnected from actual price action. However, as a range-bound indicator, the Stoch RSI's primary function is to identify cross-bought, overbought and oversold conditions.
Use
When we integrate it into our chart in the upper time frame, it both gives the direction of the trend more healthy and is more efficient in terms of noise reduction in terms of leaving the overbought-sold zones. Unlike the classic stochastic, I set the "d" value to 8. Even though the trend returns are a little late, we see healthier data on our graph. Trend changes in overbought zones are getting stronger. Coloring red indicates that the trend is selling, while painting green indicates that the trend is buying. I hope you find it useful, if you have any questions or suggestions, please feel free to ask.
Good luck...
It is not investment advice.
릴리즈 노트
DefinitionThe Stochastic RSI indicator (Stoch RSI) is actually an indicator of an indicator. It is used in technical analysis to provide a stochastic calculation to the RSI indicator. This means it's an RSI measure relative to its own high/low range over a user-defined time period. Stochastic RSI is an oscillator that calculates a value between 0 and 1 and then plots it as a line. This indicator is primarily used to identify overbought and oversold conditions.
It is important to remember that the Stoch RSI is an indicator of an indicator that is two steps away from the price. The RSI is one step away from the price and therefore a stochastic calculation of the RSI is two steps away. This is important because as with any indicator that is more than one step away from price, the Stoch RSI can be short-term disconnected from actual price action. However, as a range-bound indicator, the Stoch RSI's primary function is to identify cross-bought, overbought and oversold conditions.
Use
When we integrate it into our chart in the upper time frame, it both gives the direction of the trend more healthy and is more efficient in terms of noise reduction in terms of leaving the overbought-sold zones. Unlike the classic stochastic, I set the "d" value to 8. Even though the trend returns are a little late, we see healthier data on our graph. Trend changes in overbought zones are getting stronger. Coloring red indicates that the trend is selling, while painting green indicates that the trend is buying. I hope you find it useful, if you have any questions or suggestions, please feel free to ask.
Good luck...
It is not investment advice.
Bar color feature added. 12/08/2024
오픈 소스 스크립트
트레이딩뷰의 진정한 정신에 따라, 이 스크립트의 작성자는 이를 오픈소스로 공개하여 트레이더들이 기능을 검토하고 검증할 수 있도록 했습니다. 작성자에게 찬사를 보냅니다! 이 코드는 무료로 사용할 수 있지만, 코드를 재게시하는 경우 하우스 룰이 적용된다는 점을 기억하세요.
면책사항
해당 정보와 게시물은 금융, 투자, 트레이딩 또는 기타 유형의 조언이나 권장 사항으로 간주되지 않으며, 트레이딩뷰에서 제공하거나 보증하는 것이 아닙니다. 자세한 내용은 이용 약관을 참조하세요.
오픈 소스 스크립트
트레이딩뷰의 진정한 정신에 따라, 이 스크립트의 작성자는 이를 오픈소스로 공개하여 트레이더들이 기능을 검토하고 검증할 수 있도록 했습니다. 작성자에게 찬사를 보냅니다! 이 코드는 무료로 사용할 수 있지만, 코드를 재게시하는 경우 하우스 룰이 적용된다는 점을 기억하세요.
면책사항
해당 정보와 게시물은 금융, 투자, 트레이딩 또는 기타 유형의 조언이나 권장 사항으로 간주되지 않으며, 트레이딩뷰에서 제공하거나 보증하는 것이 아닙니다. 자세한 내용은 이용 약관을 참조하세요.