OPEN-SOURCE SCRIPT
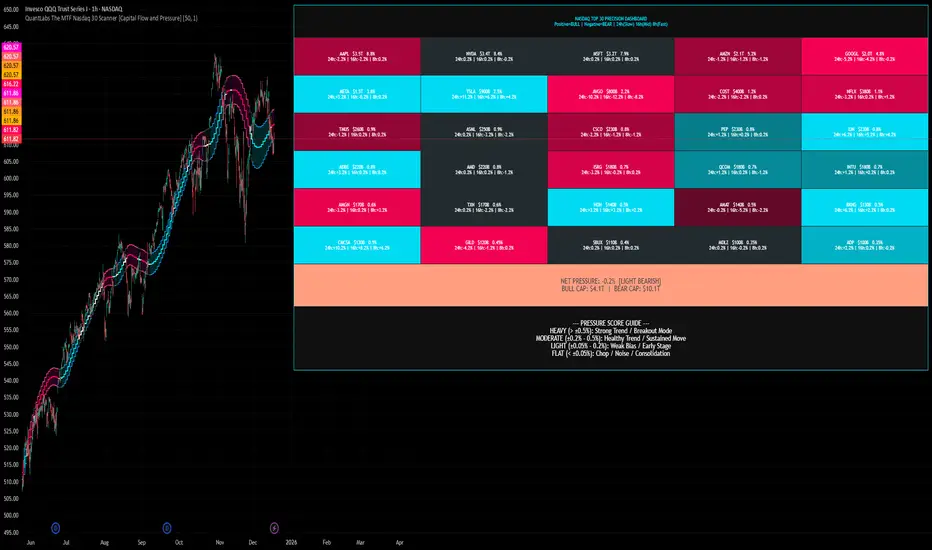
QuantLabs The MTF Nasdaq 30 Scanner [Capital Flow and Pressure]
Trading the QQQ (Nasdaq) without knowing what the Generals (Apple, Nvidia, Microsoft) are doing is like driving at night with your headlights off. You might see the road right in front of you, but you'll miss the turn coming up.
The QuantLabs MTF Nasdaq 30 Scanner [Capital Flow and Pressure] is not just a trend indicator, it is a professional-grade Market Dashboard that visualizes the heartbeat of the entire Nasdaq 100.
Why You Need This
Standard indicators lag. They tell you what happened after the move. This Heatmap tracks the Real-Time Capital Flow of the Top 30 companies that actually move the index ($Trillions in Market Cap).
Key Features
1. The "Spectacular" Precision Heatmap
Organized by Market Cap Size (AAPL/NVDA first).
Instantly spot divergent behavior. Is the market rallying, or is it just Nvidia holding everything up? The Heatmap reveals the truth instantly.
Colors: Neon Cyan (Bullish) vs Hot Pink (Bearish).
2. Triple Spectrum Technology (3-in-1 Timeframes) Why look at one timeframe when you can see three? Every cell in the dashboard displays the trend distance for:
8h (Fast): For scalping entries.
16h (Mid): For swing trends.
24h (Slow): For the major "Big Picture" bias.
Values denote % distance from the Flux Ribbon.
3. The "Net Pressure" Gauge (The Speedometer) A predictive summary footer that calculates the Weighted Pressure of the entire market.
HEAVY (> 0.5%): Strong Trend / Breakout Mode.
MODERATE (0.2% - 0.5%): Healthy, sustained move.
FLAT: Chop / Noise. Stay out.
It also shows exactly how much Capital ($Trillions) is sitting Bullish vs Bearish.
How to Trade with It
Check the "Net Pressure": If it says MODERATE BULLISH, you are looking for Longs only.
Scan the Top Row: Are the "Big 5" (AAPL, NVDA, MSFT...) aligned with the pressure?
Wait for Alignment: If the 8h, 16h, and 24h metrics all turn Cyan, that is a "Quantum Lock"—a high probability breakout signal.
Simple. Powerful. Neon. Add it to your chart and stop guessing the direction.
Credits: Built with 💜 by David James @ QuantLabs
오픈 소스 스크립트
트레이딩뷰의 진정한 정신에 따라, 이 스크립트의 작성자는 이를 오픈소스로 공개하여 트레이더들이 기능을 검토하고 검증할 수 있도록 했습니다. 작성자에게 찬사를 보냅니다! 이 코드는 무료로 사용할 수 있지만, 코드를 재게시하는 경우 하우스 룰이 적용된다는 점을 기억하세요.
면책사항
해당 정보와 게시물은 금융, 투자, 트레이딩 또는 기타 유형의 조언이나 권장 사항으로 간주되지 않으며, 트레이딩뷰에서 제공하거나 보증하는 것이 아닙니다. 자세한 내용은 이용 약관을 참조하세요.
오픈 소스 스크립트
트레이딩뷰의 진정한 정신에 따라, 이 스크립트의 작성자는 이를 오픈소스로 공개하여 트레이더들이 기능을 검토하고 검증할 수 있도록 했습니다. 작성자에게 찬사를 보냅니다! 이 코드는 무료로 사용할 수 있지만, 코드를 재게시하는 경우 하우스 룰이 적용된다는 점을 기억하세요.
면책사항
해당 정보와 게시물은 금융, 투자, 트레이딩 또는 기타 유형의 조언이나 권장 사항으로 간주되지 않으며, 트레이딩뷰에서 제공하거나 보증하는 것이 아닙니다. 자세한 내용은 이용 약관을 참조하세요.