OPEN-SOURCE SCRIPT
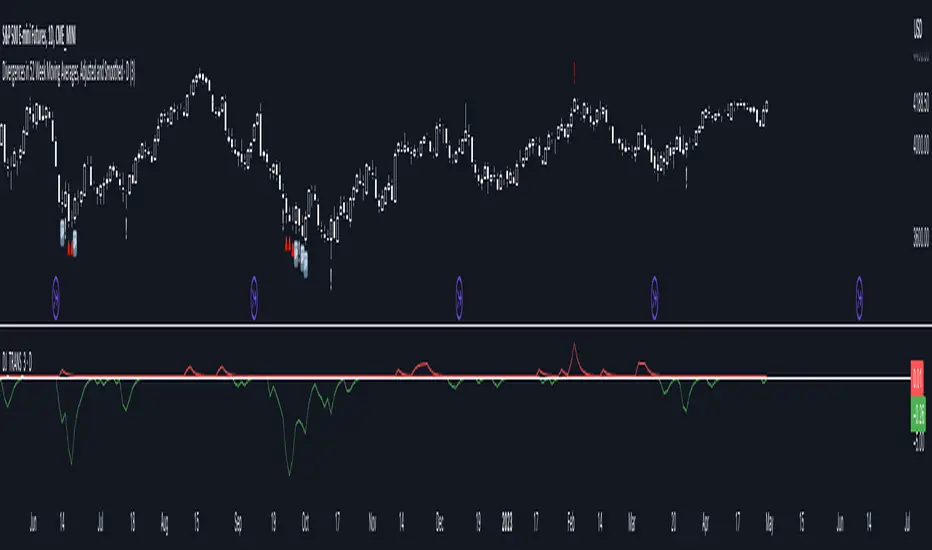
Divergences in 52 Week Moving Averages, Adjusted and Smoothed
This script description is intended to be holistic and comprehensive for the understanding of the interested parties who view the script.
Following the PineCoders suggestions, I have provided detailed breakdowns both within the code and in the description immediately below:
► Description
This description is intended to be detailed and meaningful, conveying the understanding of the script’s intention to the user:
The theory: Divergences and extreme readings in 52-Week highs on major indexes can provide a view into a potential pending move in the opposite direction of how the market has been trending. By comparing the 52-Week Hi/Lo indices and applying an Exponential Moving Average (EMA), we can assess how extreme a move is from the average. If the move provides an extreme reading, it would potentially be beneficial to “fade” the move (take a position in the opposing direction).
The intention: The intentionality of this script is to provide a visualization of when the highly-probable opportunity to fade over a multi-day or multi-week period arises. In addition to this, based on backtesting prior moves and reading the various levels of significant reversals, three tiers: “Standard”, “Sensitive”, and “Highly Sensitive” have been applied, the user can choose which sensitivity level they would like to see, there are far less false positives on the Standard and Sensitive settings, while Highly Sensitive often signals multiple times with the move coming a few days later.
The application: The settings allow the user to customize their sensitivity to the fade signals, with the ability to customize the visual that shows up as well. For higher-highs that are fade-worthy, the signal will appear on the top of the candle, for lower-lows that are fade-worthy, the signal will appear on the bottom of the candle. The users risk criteria should be the primary driver of the entry/exit, although when backtesting it appears that the significant move is typically completed within a 2-4 week period at max and 3-5 day period at minimum.
A personal note: I am a futures trader intraday but would very strongly caution users when using this strategy with futures (unless their risk tolerance is higher than most). The most beneficial strategy when fading moves would be to enter in tranches, starting at the first signal and adding on any pullback (as long as the pullback is not below the initial entry point). 1-6 Week Date-To-Expiry options would be the primary method for applying this strategy. I would also like to add that SPY/SPX options (SPDR S&P 500 ETF Trust / CBOE S&P 500 Index) are the most liquid options that could be applied in this strategy.
► Description (additional)
With the understanding that few users can read pinescript (Pine), the description above contains all of the necessary information that is necessary for a user to understand the intention for script utilization. For those who do understand Pine, the code is commented in each section in order to provide an understanding of the underlying functions, calculations, and thought process that went on during the writing of the script.
► Description (additional)
This script’s description contains no delegations, all aspects of the script as well as the initial idea behind it are contained in the description above, which is self-contained in it’s entirety with a clear and defined purpose that is written with the intent to holistically capture the intent of the potential use for this indicator.
► General House Rule #2
This script and the description (as well as my profile) contain no links or associations to promotion of any kind, I am not a business, I am not an individual that will in any way make money from this script or the promotion of another person, idea, company, entity, or legal persons (foreign or domestic).
► Originality and usefulness
This is an original and custom script (and idea) that is not a rehashing or a copy of any code from any other programmers in the tradingview community.
오픈 소스 스크립트
트레이딩뷰의 진정한 정신에 따라, 이 스크립트의 작성자는 이를 오픈소스로 공개하여 트레이더들이 기능을 검토하고 검증할 수 있도록 했습니다. 작성자에게 찬사를 보냅니다! 이 코드는 무료로 사용할 수 있지만, 코드를 재게시하는 경우 하우스 룰이 적용된다는 점을 기억하세요.
Man is not what he thinks he is, he is what he hides.
면책사항
해당 정보와 게시물은 금융, 투자, 트레이딩 또는 기타 유형의 조언이나 권장 사항으로 간주되지 않으며, 트레이딩뷰에서 제공하거나 보증하는 것이 아닙니다. 자세한 내용은 이용 약관을 참조하세요.