OPEN-SOURCE SCRIPT
업데이트됨 Vortex Indicator With SMA
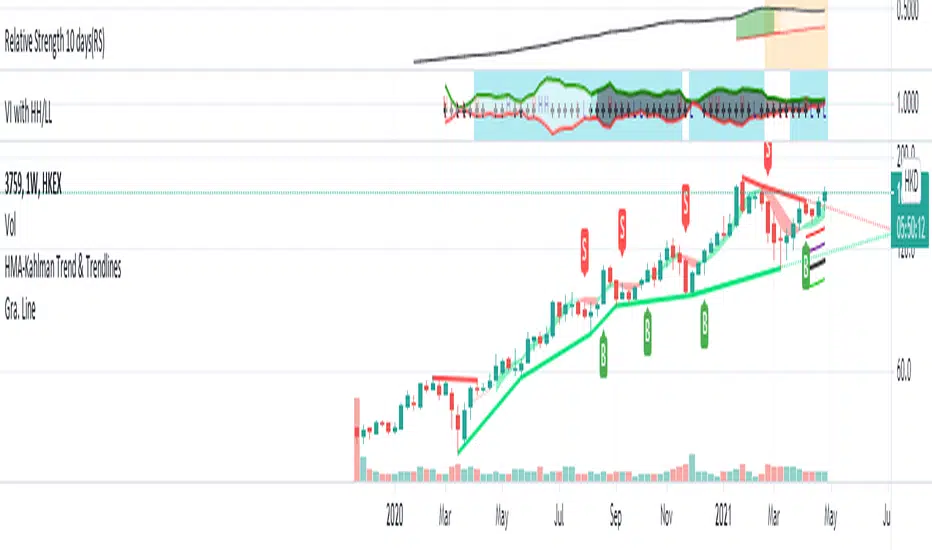
VI with SMA to determine the trend is solid.
VI+ cross over VI- with price over 20 SMA to confirm the trend.
Also, you can see the enhanced trend:
VI+ with the Letter H, with new high in the observe period.
VI- with the Letter L, with new high in the observe period.
Coding based on the original Vortex Indicator.
VI+ cross over VI- with price over 20 SMA to confirm the trend.
Also, you can see the enhanced trend:
VI+ with the Letter H, with new high in the observe period.
VI- with the Letter L, with new high in the observe period.
Coding based on the original Vortex Indicator.
릴리즈 노트
Add Test VI+, VI- with uptrend STR (Sum of ATR)릴리즈 노트
Check stocks SMA uptrend sequence with VI릴리즈 노트
Uptrend SMA Seq. title.릴리즈 노트
1: Modified the Background highlight factor:either use SMA or Donchain Channel mid line as Oscillator.
2: Fill the area between VI+ and VI - when the SMA uptrend Sequence is valid.
릴리즈 노트
Traditionally, vortex indicator (VI) is an indicator composed of two lines : an uptrend line (VI+) : measure the price of the stock going up
a downtrend line (VI-) : measure the price of the stock going down
bleached areas within two VI lines is showing the "the fastEMA above slowEMA" of the stock.
eg. SMA10 > SMA40
"H" means that the VI+ > 5 days average VI+, which means stock price is move up relative to the price past 5 days average. ( simply is price action hgiher high)
"L" means that the VI- > 5 days average VI-, which means stock price decline relative to the price past 5 days average. ( simply is price action lower low)
In conclusion, I create this indicator help to easily knowing a stock is in uptrend and the momentum is maintain.
Two examples:
Look for Uptrend stock
1) the trading logic is looking for uptrend stocks (with blue background).
2) blue background where [VI+ is above VI- ] and [ stock price is above EMA or Donchain channel] .
3) "H" equal to [ VI+ is increase ] means the up-force is improving. "H" in red mean the price velocity is increase.
4) it is better hold the stock when the VI+ is keep move up. and be alert the "L" show up.
Look for Bottom UP/Breakout
1) when the background is in PINK, means [ VI- > VI+ ]. Stock is in downtrend.
2) waiting for the word "H" show up in frequent (several times), mean the stock price start have a high compare 5 days average.
3) wait for the crossover of the VI+ and VI- and the background to Blue.
오픈 소스 스크립트
트레이딩뷰의 진정한 정신에 따라, 이 스크립트의 작성자는 이를 오픈소스로 공개하여 트레이더들이 기능을 검토하고 검증할 수 있도록 했습니다. 작성자에게 찬사를 보냅니다! 이 코드는 무료로 사용할 수 있지만, 코드를 재게시하는 경우 하우스 룰이 적용된다는 점을 기억하세요.
면책사항
해당 정보와 게시물은 금융, 투자, 트레이딩 또는 기타 유형의 조언이나 권장 사항으로 간주되지 않으며, 트레이딩뷰에서 제공하거나 보증하는 것이 아닙니다. 자세한 내용은 이용 약관을 참조하세요.
오픈 소스 스크립트
트레이딩뷰의 진정한 정신에 따라, 이 스크립트의 작성자는 이를 오픈소스로 공개하여 트레이더들이 기능을 검토하고 검증할 수 있도록 했습니다. 작성자에게 찬사를 보냅니다! 이 코드는 무료로 사용할 수 있지만, 코드를 재게시하는 경우 하우스 룰이 적용된다는 점을 기억하세요.
면책사항
해당 정보와 게시물은 금융, 투자, 트레이딩 또는 기타 유형의 조언이나 권장 사항으로 간주되지 않으며, 트레이딩뷰에서 제공하거나 보증하는 것이 아닙니다. 자세한 내용은 이용 약관을 참조하세요.