OPEN-SOURCE SCRIPT
업데이트됨 FalconRed 3 Candlestick Levels
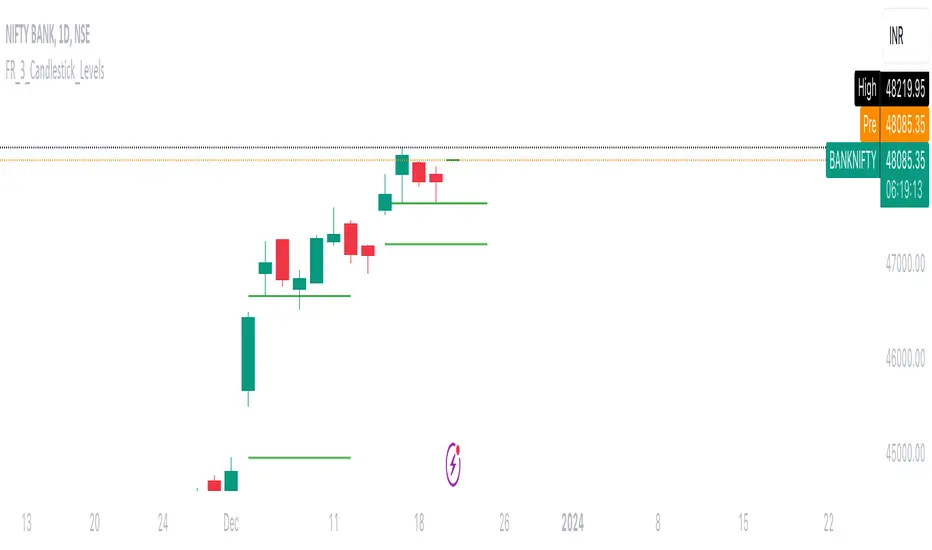
This Pine Script indicator is designed to enhance price action analysis by identifying specific candle patterns that signal potential buying and selling levels. The analysis is based on the characteristics of the current candle and its two immediate predecessors.
For identifying buying levels, the script examines the wicks of the candles, highlighting areas where buying and selling struggle is evident. The indicator recognizes significant breaks above wick levels, especially when followed by a subsequent candle with a lower wick. This combination suggests that previous selling pressure has been challenged and overcome.
Buy breakout and retest levels are highlighted with green color, providing a clear visual indication of potential buying opportunities. The indicator draws horizontal lines that extend to the right, offering insights into the frequency of retests and the recurrence of similar patterns in specific price zones, thereby confirming and reinforcing the observed price action.
Similarly, the indicator scrutinizes the selling side, pinpointing breakdown and retest levels. These areas are highlighted with red color, aiding in the identification of potential selling opportunities.
This indicator serves as a valuable tool for analyzing price action levels and visualizing buying and selling areas. It can be effectively combined with other technical indicators to enhance confidence in trading decisions. Gain deeper insights into market dynamics and improve decision-making by integrating this candle pattern analysis indicator into your trading strategy.
릴리즈 노트
This Pine Script indicator is designed to enhance price action analysis by identifying specific candle patterns that signal potential buying and selling levels. The analysis is based on the characteristics of the current candle and its two immediate predecessors.For identifying buying levels, the script examines the wicks of the candles, highlighting areas where buying and selling struggle is evident. The indicator recognizes significant breaks above wick levels, especially when followed by a subsequent candle with a lower wick. This combination suggests that previous selling pressure has been challenged and overcome.
Buy breakout and retest levels are highlighted with green color, providing a clear visual indication of potential buying opportunities. The indicator draws horizontal lines that extend to the right, offering insights into the frequency of retests and the recurrence of similar patterns in specific price zones, thereby confirming and reinforcing the observed price action.
Similarly, the indicator scrutinizes the selling side, pinpointing breakdown and retest levels. These areas are highlighted with red color, aiding in the identification of potential selling opportunities.
This indicator serves as a valuable tool for analyzing price action levels and visualizing buying and selling areas. It can be effectively combined with other technical indicators to enhance confidence in trading decisions. Gain deeper insights into market dynamics and improve decision-making by integrating this candle pattern analysis indicator into your trading strategy.
오픈 소스 스크립트
트레이딩뷰의 진정한 정신에 따라, 이 스크립트의 작성자는 이를 오픈소스로 공개하여 트레이더들이 기능을 검토하고 검증할 수 있도록 했습니다. 작성자에게 찬사를 보냅니다! 이 코드는 무료로 사용할 수 있지만, 코드를 재게시하는 경우 하우스 룰이 적용된다는 점을 기억하세요.
면책사항
해당 정보와 게시물은 금융, 투자, 트레이딩 또는 기타 유형의 조언이나 권장 사항으로 간주되지 않으며, 트레이딩뷰에서 제공하거나 보증하는 것이 아닙니다. 자세한 내용은 이용 약관을 참조하세요.
오픈 소스 스크립트
트레이딩뷰의 진정한 정신에 따라, 이 스크립트의 작성자는 이를 오픈소스로 공개하여 트레이더들이 기능을 검토하고 검증할 수 있도록 했습니다. 작성자에게 찬사를 보냅니다! 이 코드는 무료로 사용할 수 있지만, 코드를 재게시하는 경우 하우스 룰이 적용된다는 점을 기억하세요.
면책사항
해당 정보와 게시물은 금융, 투자, 트레이딩 또는 기타 유형의 조언이나 권장 사항으로 간주되지 않으며, 트레이딩뷰에서 제공하거나 보증하는 것이 아닙니다. 자세한 내용은 이용 약관을 참조하세요.