INVITE-ONLY SCRIPT
مؤشر الحوت الأول
✅ History (Signals)
• Most prominent buy/sell signals (Buy/Sell).
• Smart buy/sell signals (Smart Buy/Sell) are compatible with price alignment with the trend and EMA.
• Reversal indicators (Reversal signals) when the market is overbought/oversold.
• Channel breakouts signals when strong price levels are broken.
⸻
✅ Errors (Trend)
• Average trend bar: A multi-colored set with a custom background color.
• Trend Cloud: A cloud between the EMA150 and EMA250 that gives you the strength of the error (bullish/bearish).
• Chaos trend line: A moving ATR line (like a trailing stop) to confirm the error.
• EMA200: A solid line for general correction.
⸻
✅ Colors and Candlestick Reading
• Candlesticks are colored according to the Relative Strength Index (RSI) or the trend.
• Different colors indicate buying or selling strength (low RSI → red, high RSI →).
⸻
✅ Relative Strength Index + Oversold Zones
• Cap chart based on the Relative Strength Index (RSI):
• Green = Light overbought.
• Red = Light oversold.
• Measures oversold conditions and integrates with Facebook to confirm entry/exit.
⸻
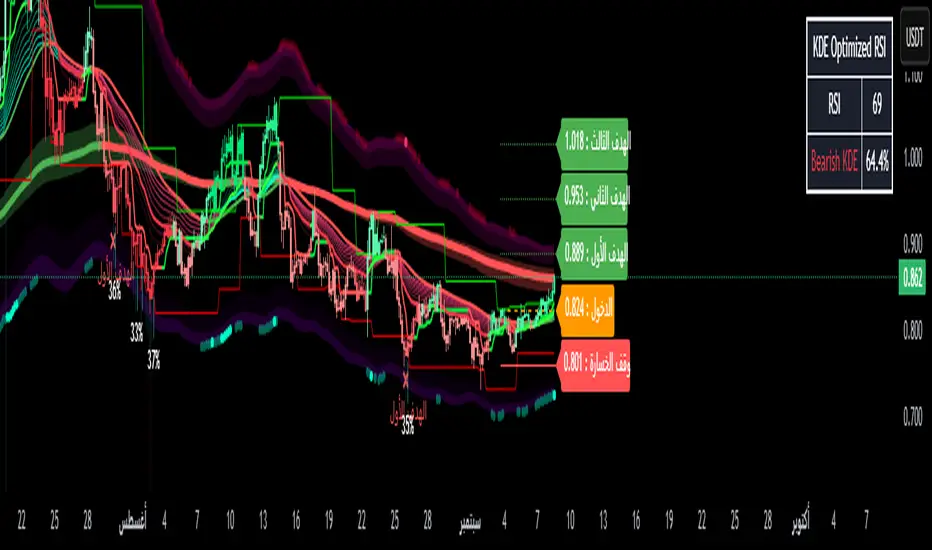
✅ Dashboard
Located below the chart and displays:
• Volatility (weak, very strong, etc.).
• Current RSI value.
• Over the same timeframe (3-minute, 5-minute, 15-minute, 1-hour, 4-hour, daily, etc.).
⸻
✅ Multiple Management (Risk Management)
• Entry – Stop Loss – Stop Loss zones (TP1, TP2, TP3) are found directly on the chart.
• Draws lines and labels at entry, stop, and target levels.
• This feature can be enabled or disabled in the settings.
⸻
✅ Additional Tools
• Order Blocks (off by default in the code).
• Keltner Channels are cloud-like compression/divergence zones.
• Volatility Filter: Measures ATR and Elastic Divergence to give you the strength of the movement.
⸻
📊 In short:
Your indicator isn't just one; it's a complete suite of tools:
• Smart Buy/Sell Signals +
• Trend and Cloud + EMA200
• Reversal and Saturation Signals
• Dashboard for Multi-Timeframe Analysis
• Capital Management with Targets and Stops
• Most prominent buy/sell signals (Buy/Sell).
• Smart buy/sell signals (Smart Buy/Sell) are compatible with price alignment with the trend and EMA.
• Reversal indicators (Reversal signals) when the market is overbought/oversold.
• Channel breakouts signals when strong price levels are broken.
⸻
✅ Errors (Trend)
• Average trend bar: A multi-colored set with a custom background color.
• Trend Cloud: A cloud between the EMA150 and EMA250 that gives you the strength of the error (bullish/bearish).
• Chaos trend line: A moving ATR line (like a trailing stop) to confirm the error.
• EMA200: A solid line for general correction.
⸻
✅ Colors and Candlestick Reading
• Candlesticks are colored according to the Relative Strength Index (RSI) or the trend.
• Different colors indicate buying or selling strength (low RSI → red, high RSI →).
⸻
✅ Relative Strength Index + Oversold Zones
• Cap chart based on the Relative Strength Index (RSI):
• Green = Light overbought.
• Red = Light oversold.
• Measures oversold conditions and integrates with Facebook to confirm entry/exit.
⸻
✅ Dashboard
Located below the chart and displays:
• Volatility (weak, very strong, etc.).
• Current RSI value.
• Over the same timeframe (3-minute, 5-minute, 15-minute, 1-hour, 4-hour, daily, etc.).
⸻
✅ Multiple Management (Risk Management)
• Entry – Stop Loss – Stop Loss zones (TP1, TP2, TP3) are found directly on the chart.
• Draws lines and labels at entry, stop, and target levels.
• This feature can be enabled or disabled in the settings.
⸻
✅ Additional Tools
• Order Blocks (off by default in the code).
• Keltner Channels are cloud-like compression/divergence zones.
• Volatility Filter: Measures ATR and Elastic Divergence to give you the strength of the movement.
⸻
📊 In short:
Your indicator isn't just one; it's a complete suite of tools:
• Smart Buy/Sell Signals +
• Trend and Cloud + EMA200
• Reversal and Saturation Signals
• Dashboard for Multi-Timeframe Analysis
• Capital Management with Targets and Stops
초대 전용 스크립트
이 스크립트는 작성자가 승인한 사용자만 접근할 수 있습니다. 사용하려면 요청 후 승인을 받아야 하며, 일반적으로 결제 후에 허가가 부여됩니다. 자세한 내용은 아래 작성자의 안내를 따르거나 aymankhsara2022에게 직접 문의하세요.
트레이딩뷰는 스크립트의 작동 방식을 충분히 이해하고 작성자를 완전히 신뢰하지 않는 이상, 해당 스크립트에 비용을 지불하거나 사용하는 것을 권장하지 않습니다. 커뮤니티 스크립트에서 무료 오픈소스 대안을 찾아보실 수도 있습니다.
작성자 지시 사항
The Whale Indicator is designed to detect large liquidity movements (whales) in the market.
It features accurate entry and exit signals and draws support and resistance levels based on smart capital activity.
It helps you filter out false signals and spot
면책사항
해당 정보와 게시물은 금융, 투자, 트레이딩 또는 기타 유형의 조언이나 권장 사항으로 간주되지 않으며, 트레이딩뷰에서 제공하거나 보증하는 것이 아닙니다. 자세한 내용은 이용 약관을 참조하세요.