OPEN-SOURCE SCRIPT
ATR% Multiple From MA - Overextensions tracking
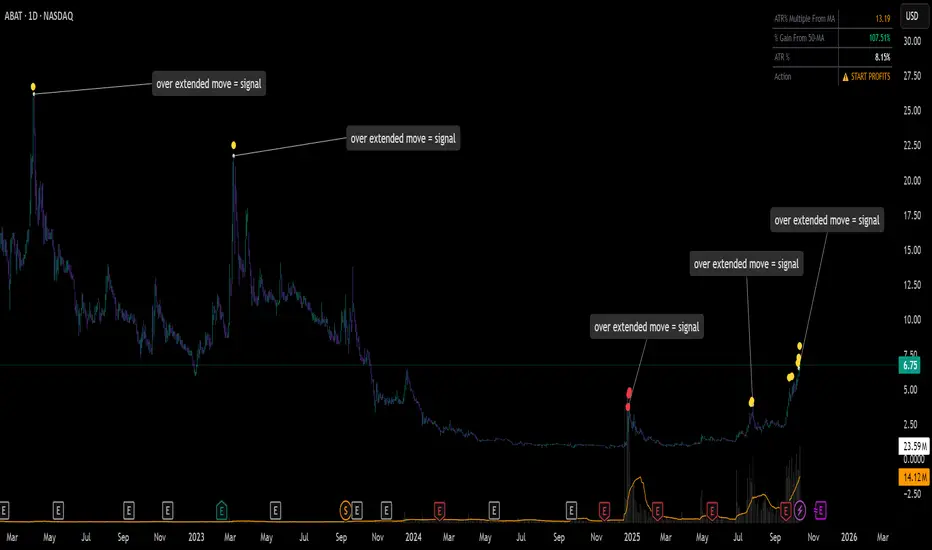
ATR% Multiple From MA - Quantifiable Profit Taking Indicator
This overlay indicator identifies overextended price moves by calculating how many ATR% multiples price is away from a moving average, providing objective profit-taking signals.
Formula:
A = ATR% = (ATR / Price) × 100
B = % Gain from MA = ((Price - MA) / MA) × 100
ATR% Multiple = B / A
Signals:
Yellow circle at 7x: Start scaling out partial profits
Red circle at 10x+: Heavily overextended, aggressive profit taking recommended
Stats table: Real-time ATR% Multiple, % Gain from MA, ATR%, and action status
For very volatile markets I usually go for 10x and 15x extension instead of 7x and 10x.
This method normalizes moves across different volatility environments, eliminating emotional decision-making. Historical examples include PLTR, SOFI, TSLA, NVDA which stalled after exceeding 10x.
Customizable Settings:
ATR Length (default: 14)
MA Length (default: 50)
Profit Zone thresholds (7x, 10x)
Toggle circles and MA display
오픈 소스 스크립트
트레이딩뷰의 진정한 정신에 따라, 이 스크립트의 작성자는 이를 오픈소스로 공개하여 트레이더들이 기능을 검토하고 검증할 수 있도록 했습니다. 작성자에게 찬사를 보냅니다! 이 코드는 무료로 사용할 수 있지만, 코드를 재게시하는 경우 하우스 룰이 적용된다는 점을 기억하세요.
면책사항
해당 정보와 게시물은 금융, 투자, 트레이딩 또는 기타 유형의 조언이나 권장 사항으로 간주되지 않으며, 트레이딩뷰에서 제공하거나 보증하는 것이 아닙니다. 자세한 내용은 이용 약관을 참조하세요.
오픈 소스 스크립트
트레이딩뷰의 진정한 정신에 따라, 이 스크립트의 작성자는 이를 오픈소스로 공개하여 트레이더들이 기능을 검토하고 검증할 수 있도록 했습니다. 작성자에게 찬사를 보냅니다! 이 코드는 무료로 사용할 수 있지만, 코드를 재게시하는 경우 하우스 룰이 적용된다는 점을 기억하세요.
면책사항
해당 정보와 게시물은 금융, 투자, 트레이딩 또는 기타 유형의 조언이나 권장 사항으로 간주되지 않으며, 트레이딩뷰에서 제공하거나 보증하는 것이 아닙니다. 자세한 내용은 이용 약관을 참조하세요.